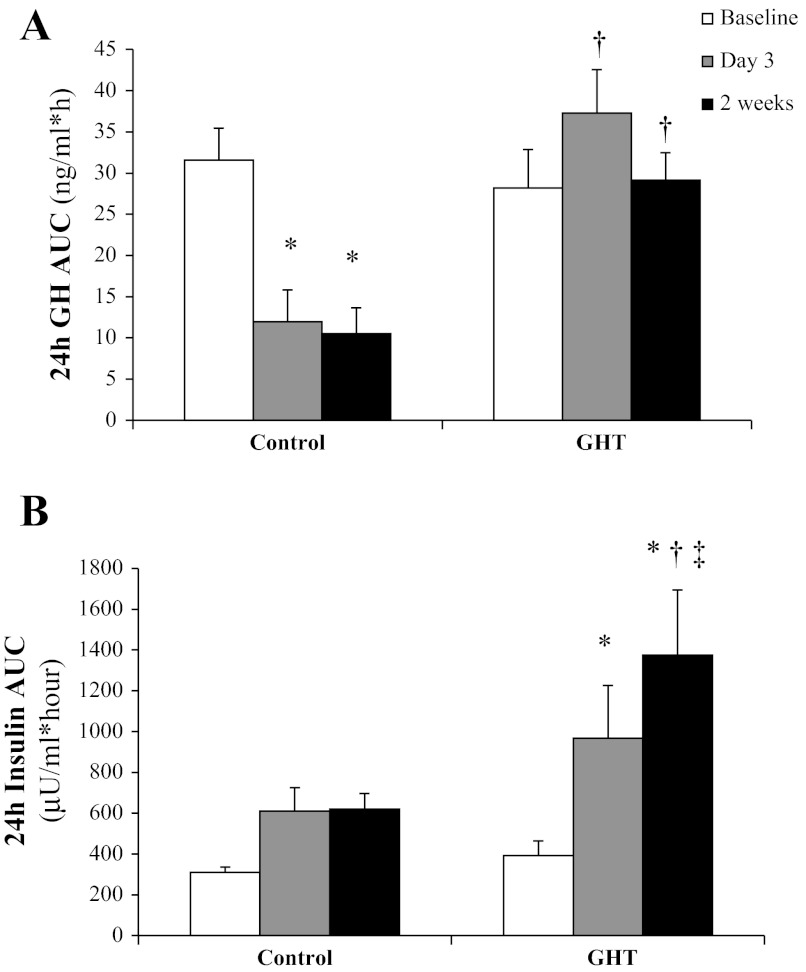
Fig. 2.
Twenty-four-hour area under the curve (AUC) for plasma GH concentration measured every 20 min for 24 h (A) and 24-h AUC plasma insulin concentration measured every 2 h for 24 h (B) before overeating, by day 3 of overeating, and by the end of the 2-wk overeating period in subjects who did not receive any GH treatment (control) and subjects who received low doses of GH daily (GHT). *Significantly different from baseline within treatment, P < 0.05. †Significantly different from control on the same day, P < 0.05. ‡Significantly greater than day 3, P < 0.05.

