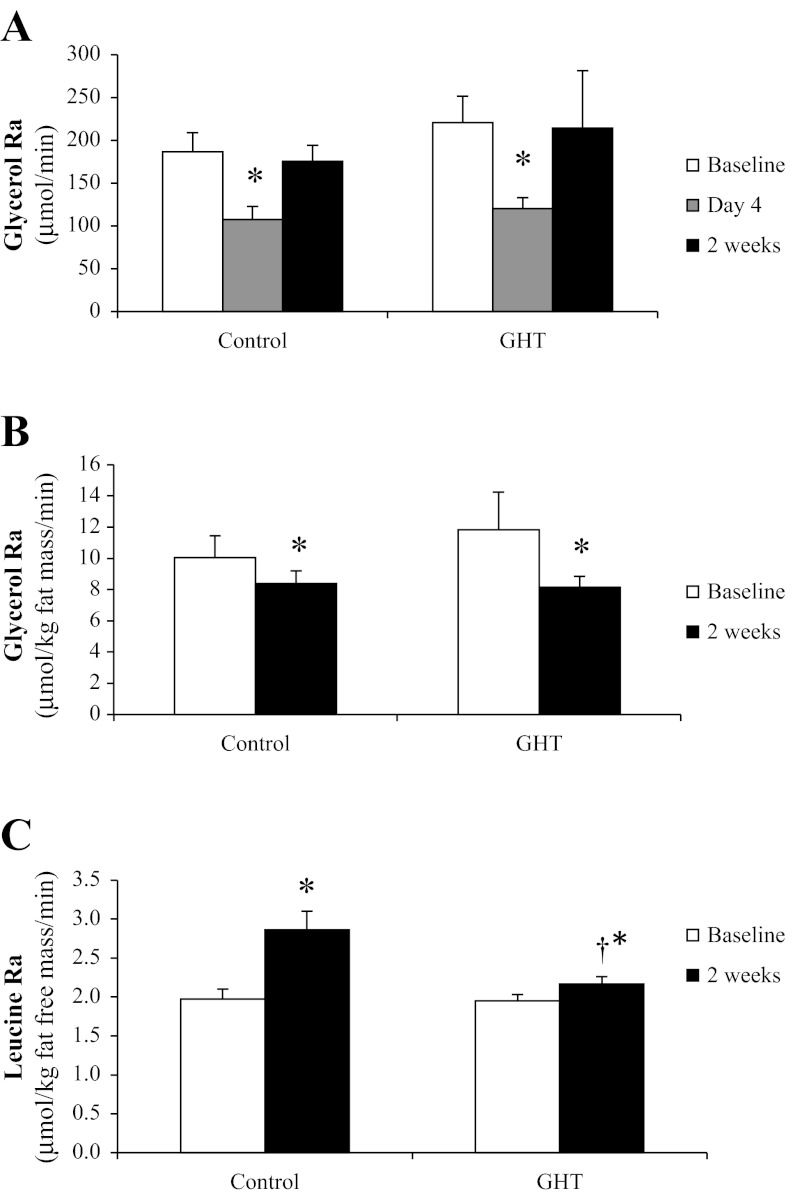
Fig. 5.
Lipolytic rate [glycerol rate of appearance (Ra)] measured after an overnight fast before and after the 2-wk overeating intervention expressed in absolute terms (μmol/min; A) and expressed relative to fat mass (μmol·kg fat mass−1·min−1; B) in both control and GHT. C: proteolytic rate (leucine Ra) measured after an overnight fast before and after the 2-wk overeating intervention in both control and GHT. *Significantly different from baseline within treatment, P < 0.05. †Significantly different from control at 2 wk, P < 0.05.

