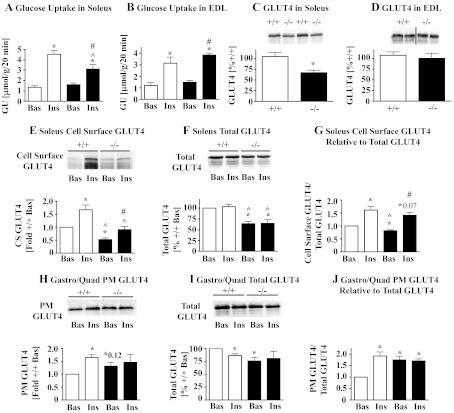
Fig. 3.
A and B: glucose uptake in soleus and EDL muscles. 2-Deoxyglucose uptake was determined in isolated soleus (A) and EDL muscles (B) isolated from 10-wk-old male AS160−/− (filled bars) and AS160+/+ mice (open bars) in the absence (Bas) and presence of 13 nM insulin (Ins). GU data expressed in μmol·g−1·20 min−1 represent means ± SE (n = 6). *P < 0.05 comparing data with AS160+/+ Bas; ^P < 0.05 comparing data for AS160+/+ Ins and AS160−/− Ins; #P < 0.05 comparing data for AS160−/− Bas and AS160−/− Ins using unpaired 2-tailed t-tests. C and D: GLUT4 expression in soleus and EDL muscles. GLUT4 expression was determined by immunoblotting of soleus (C) and EDL (D) homogenates obtained from 10 (C) and 6- to 7- (D) wk-old male AS160−/− and AS160+/+ mice. Top: representative results for 2 samples for each genotype from the same immunoblot; bottom: quantitations of GLUT4 signals on immunoblots (means ± SE, n = 3–4) in %+/+ (with one AS160+/+ sample assigned a value of 100%). *P < 0.05 compares AS160−/− with AS160+/+ data with unpaired 2-tailed t-tests. Experiments shown in A–D were also performed with 5-wk-old female and 20-wk-old male and female mice, and similar results were obtained. E–G: soleus cell surface GLUT4. Soleus muscles were isolated from 9-wk-old female AS160−/− (filled bars) and AS160+/+ mice (open bars), incubated without (Bas) or with 130 nM insulin and muscles processed and evaluated as described for Fig. 2, G–I. Representative immunoblots for cell surface GLUT4 (derived from entire streptavidin precipitates) and total GLUT4 (1/25 of total membrane pellet or ∼50 μg total membrane protein), respectively, are shown in E, top, soleus cell surface GLUT4 and F, soleus total GLUT4. Signals on immunoblots were quantified and corrected for protein input, and means ± SE (n = 3–4) were plotted (bar graphs below respective immunoblots). The ratios cell surface/total GLUT4 were calculated and data (means ± SE, n = 3–4) plotted (G: soleus cell surface GLUT4 relative to total GLUT4). *P < 0.05 (unless indicated otherwise) for comparisons of data with AS160+/+ Bas (1-sample t-tests with AS160+/+ Bas assigned a value of 100 or 1); ^P < 0.05 for comparison AS160−/− Bas and AS160−/− Ins with AS160+/+ Ins; #P < 0.05 for comparison between AS160−/− Bas and AS160−/− Ins using unpaired 2-tailed t-tests. Preliminary studies with soleus isolated from male mice yielded similar results as shown for female. H–J: Gastro/Quad PM-associated GLUT4. Experiment was carried out as described in Fig. 2, D–F, with 10- to 14-wk-old male AS160−/− (filled bars) and AS160+/+ mice (open bars) but gastrocnemius and quadriceps muscles were isolated, pooled (Gastro/Quad), and subjected to subcellular fractionation. Immunoblots for GLUT4 were performed on PM GLUT4 (5 μg protein/lane) and total membranes (total GLUT4)(10 μg protein/lane), and representative immunoblots for one subcellular fractionation are shown in H, Gastro/Quad PM GLUT4, and I, Gastro/Quad total GLUT4, respectively. Signals on immunoblots were quantified, and means ± SE (n = 4) were plotted (bar graphs below respective immunoblots). Ratios for PM GLUT4/Total GLUT4 (means ± SE, n = 4) were calculated as described in Fig. 2F and plotted (I: Gastro/Quad PM GLUT4 relative to total GLUT4). *P < 0.05 (unless indicated otherwise) comparing data to AS160+/+ Bas using 1-sample t-tests, with AS160+/+ Bas assigned a value of 100 or 1. Preliminary studies with subcellular fractions from Gastro/Quad isolated from female mice yielded similar results as shown for male.

