Fig. 3.
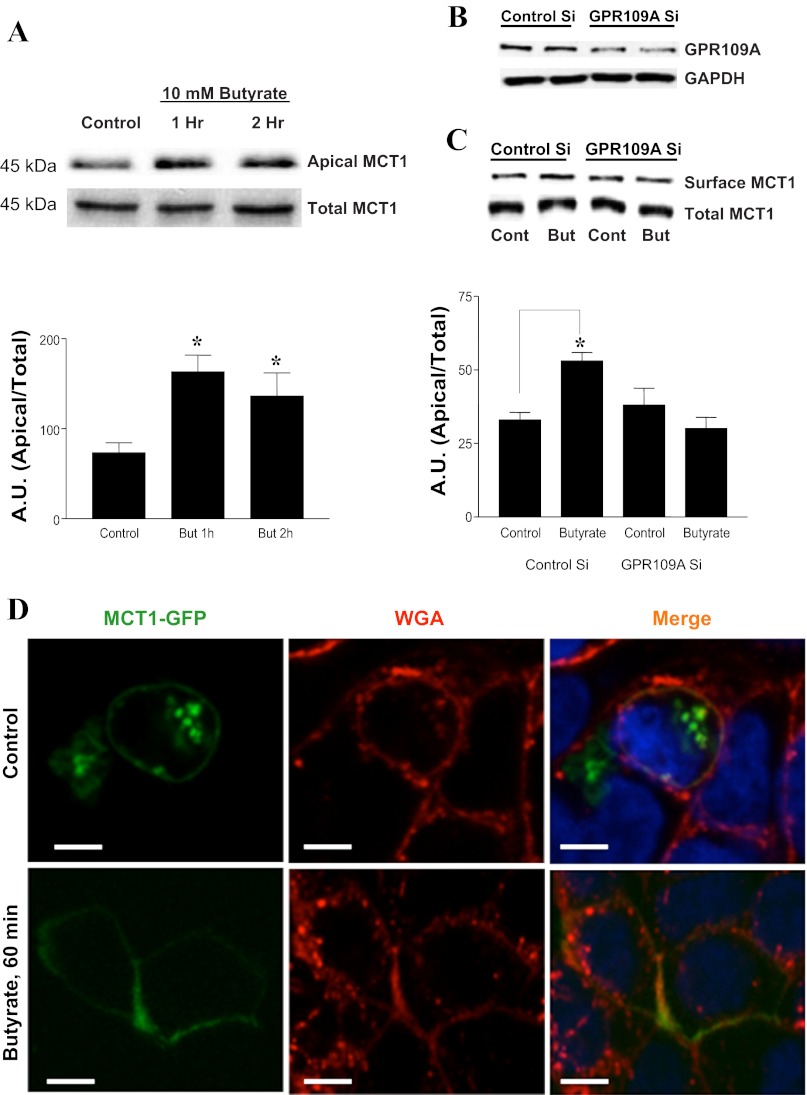
Butyrate increases cell surface MCT1 levels in C2BBe1 cells in a GPR109A-dependent manner: A: cell monolayers (14-day postplating) were treated with 10 mM butyrate for the indicated time periods, and apical membrane MCT1 levels were measured by cell surface biotinylation; top: the band intensities of apical vs. total MCT1 in different groups; bottom: densitometric analysis of band intensities (AU, arbitrary units of band intensity). B: cells were transfected with control-scrambled siRNA or GPR109A siRNA as described in materials and methods. Forty-eight hours after transfection, cells were either used to measure GPR109 levels by immunoblotting with anti-GPR109A antibody (B) or to measure surface MCT1 by cell surface biotinylation (C). C, bottom: densitometric analysis of MCT1 band intensities. D: plasma membrane MCT1-green fluorescent protein (GFP) levels in response to butyrate treatments were measured in C2BBE cells transiently transfected with MCT-GFP fusion constructs and probed with anti-GFP antibodies in immunofluorescence studies. GFP, green fluorescent protein; WGA, wheat germ agglutinin. *P < 0.05.

