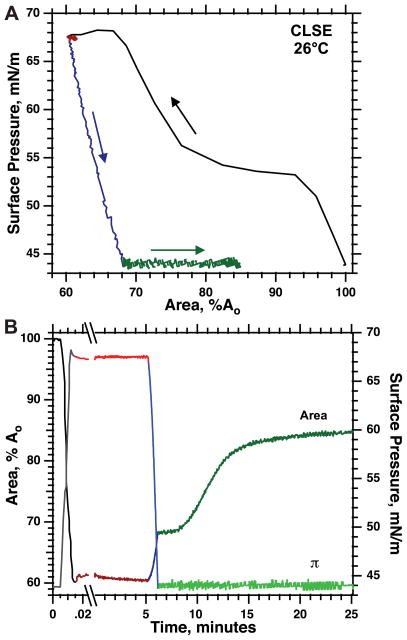
Fig. 2.
Isothermal expansion of supercompressed CLSE at surface pressure (π) < equilibrium surface pressure (πe). Films were spread to 35 mN/m at ambient temperatures and heated to 27.5°C. After slow compression to 44 mN/m (not shown), the films were compressed rapidly to 68 mN/m, held at constant π for 5 min, expanded slowly to 44 mN/m, and then held at that π during isobaric (constant π), isothermal expansion. Area is normalized to the initial value at 44 mN/m (Ao) before the rapid compression. Curves are representative of three experiments. A: variation of π with area to clarify the sequence of maneuvers. Arrows indicate the temporal progression of the measurements. B: the same data expressed as the variation of π (right axis) and area (left axis) with time. Split abscissa illustrates the time scale of the initial compression. Colors indicate the same data in the two graphs.

