
Figure 3. Lipid droplet clearance is more efficient in the presence of microbiota.
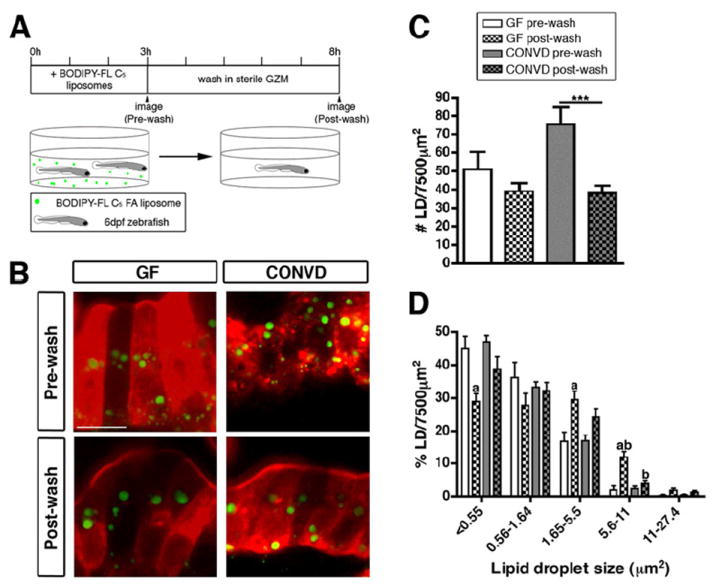
(A) Schematic representation of the BODIPY-FL C5 washout experiment.
(B) Representative confocal images of control-fed GF and CONVD zebrafish pre- and post-wash. Scale bar, 10 μm.
(C,D) Quantification of lipid droplet (LD) number (C) and relative size frequency (D), shown as the mean ± SEM from two independent experiments (4-14 fish/condition/experiment), and significant differences are identified: ***, p<0.001; a, significant vs. pre-wash in same microbial condition; b, significant vs. same wash in other microbial condition. See also Figure S2.