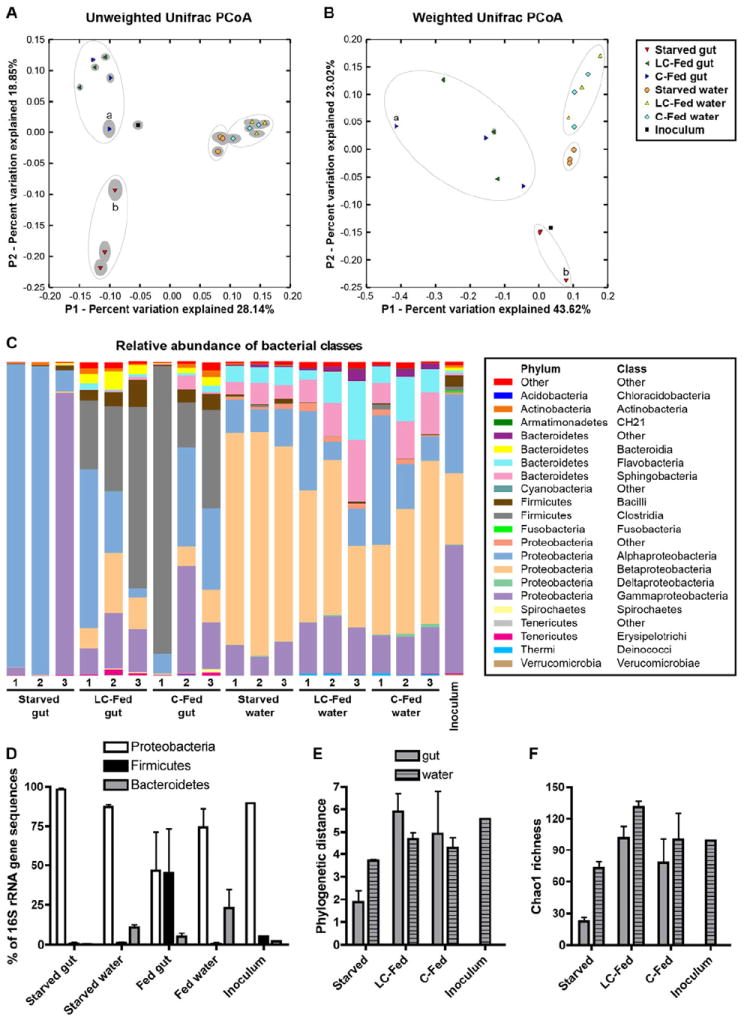
Figure 4. 16S rRNA gene sequencing reveals distinct bacterial communities in the zebrafish gut and water that are strongly influenced by dietary status.

(A,B) UniFrac principal coordinates analysis (PCoA) plots using unweighted (A) and weighted (B) algorithms. Each replicate sample is represented by a single shape, with the solid grey ellipsoid around each shape indicating the confidence interval from 100 jackknife replicates of 500 sequences per sample. Apparent clusters of samples are indicated with open ovals. Samples C-Fed gut 1 (a) and Starved gut 3 (b) are labeled. See also Table S2.
(C) Stacked bar graph showing relative abundance (Y-axis) of 16S rRNA gene sequences from different bacterial classes (legend at right) observed in different samples (X-axis).
(D) Percentage of 16S rRNA gene sequences classified as Proteobacteria, Firmicutes, and Bacteroidetes, shown as the mean ± SD across different replicate sample groups and the inoculum sample. See also Table S3. Alpha diversity measures of (E) Phylogenetic distance and (F) Chao1 richness are shown as the mean ± SD across different replicate sample groups and the inoculum sample. See also Figure S3 and Table S4.
