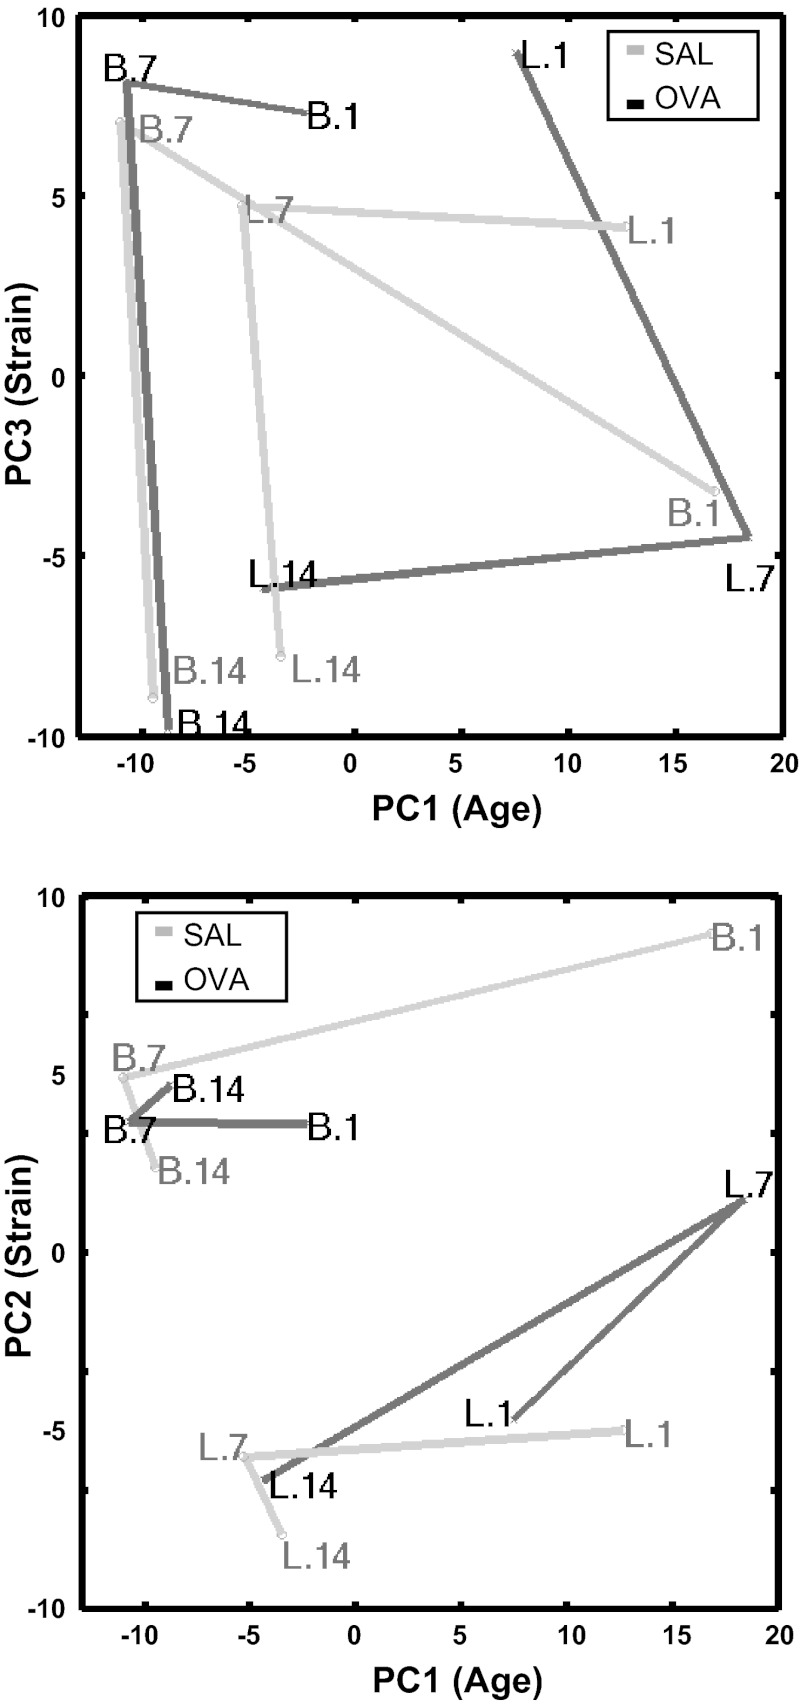
Fig. 5.
Principal component analysis of whole lung samples in 22,523-gene probe expression space. 2 replicate samples were selected per condition: 2 strains × 3 ages × 2 exposures. The principal components 1–3 (PC1–3) coordinate centroids are plotted for each condition. Samples are marked Strain.Age. Connecting lines are colored gray for SAL and black for OVA. PC1 appears to correspond to developmental age, PC2 to strain, and PC3 to a combination of age and strain.

