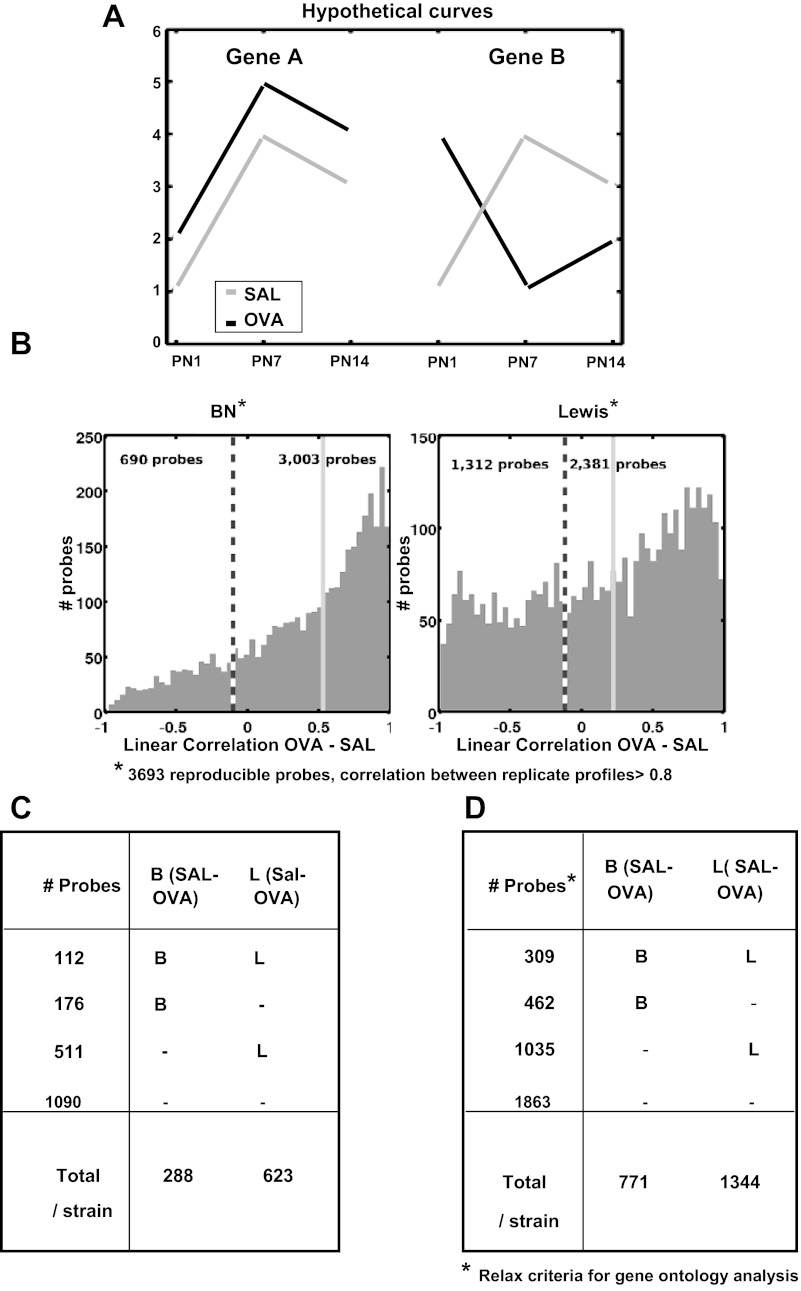
Fig. 6.
Gene expression trajectories perturbed by maternal OVA exposure. A: 2 hypothetical genes illustrating the use of linear correlation between developmental time series expression profiles to identify developmental expression affected by maternal SAL vs. OVA exposures. The SAL vs. OVA correlation value is inversely proportional to effect of OVA exposure. The expression time series for gene A is well correlated in SAL vs. OVA and poorly correlated for gene B. The expression of gene B during lung development is potentially affected by OVA exposure. If OVA exposure causes a uniform basal shift in gene expression from SAL exposure as in gene A, the OVA-SAL correlation is 1, and therefore gene A is not considered to be affected by OVA exposure when correlation is used to measure similarity. B: 3,693 reproducible probes (correlation between 1st and 2nd replicate profiles > 0.8) and the histogram of their OVA vs. SAL correlation values for each rat strain. The dashed vertical line marks the threshold for OVA effect (OVA vs. SAL correlation < −0.1), and we count the number of probes below/above this threshold. The light gray solid vertical line marks the median of OVA vs. SAL correlation values for the strain. C: of the 3,693 reproducible probe from B, 1,889 probes have loading magnitudes that are in the top 5% in PC1–3, which correspond to age-strain variation, and 799 of these are affected by OVA exposure, OVA vs. SAL correlation < −0.1 for either strain. D: for gene ontology enrichment analyses, we relaxed the criteria in C. For determining whether a probe is affected by OVA exposure, we identified 5,724 reproducible probes correlation >0.7 between 1st and 2nd replicate profiles. Of these, 3,669 probes have loading magnitudes that are in the top 10% in PC1–3, which correspond to age-strain variation, and 1,806 of these are affected by OVA exposure, OVA vs. SAL correlation < 0.0 for either rat strain.

