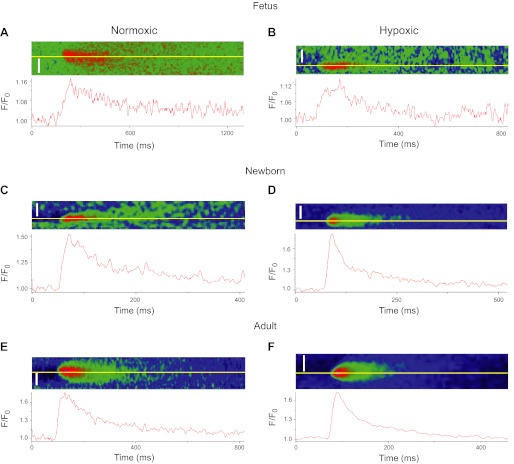
Fig. 2.
Ca2+ sparks from sheep pulmonary arterial myocytes. A–F: pseudo color filtered line scan images and associated time series profiles recorded in individual myocytes for pulmonary arteries from normoxic and long-term hypoxic adults, newborns, and fetuses. Line plots show the relative fluorescent intensity profile for the line (yellow) shown in each micrograph. Calcium spark and wave recordings for Figs. 2–8 were obtained from recordings performed in a total of 12 fetal, 8 newborn, and 8 adult normoxic sheep and from 9 fetal, 9 newborn, and 7 adult long-term hypoxic sheep with a ×60 oil immersion Apochromat objective. Scale bars = 5 μm.

