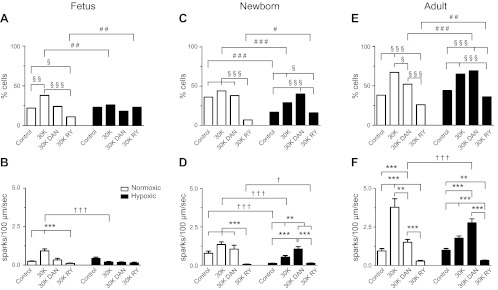
Fig. 3.
Ca2+ spark activity in pulmonary arterial myocytes and the influence of ontogeny and LTH. A, C, and E: bars are % of myocytes with sparks. B, D, and F: bars are number of sparks/100 μm/s. Ca2+ spark activity was determined by visual inspection of line scans. Each trial was ∼10 s. Measurements were made in 58–262 records from a minimum of 3 animals in each condition. §,†,#P < 0.05; **,§§,††,##P < 0.01; ***,§§§,†††,###P < 0.001 denotes significant difference within (*) groups based on the treatment using a Kruskal-Wallis 1-way ANOVA on ranks with a Dunn's multiple comparison test and (†) between groups based on their altitude using a Mann-Whitney U-test. The symbol § shows difference within groups and the symbol #, between groups based on a χ2 test.

