Fig. 5.
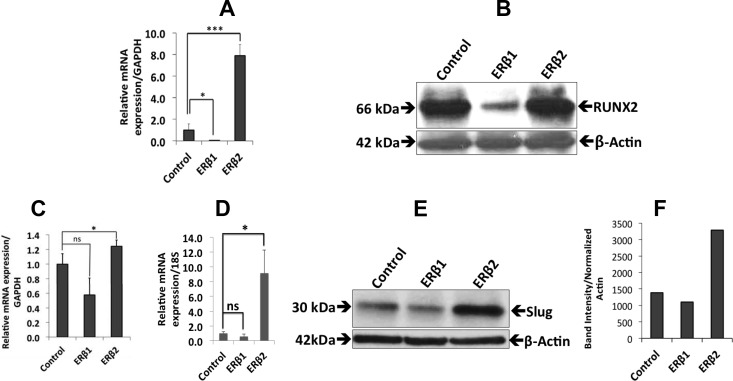
The effects of ERβ1 and ERβ2 on the expression of genes involved in bone metastasis. A, qPCR analysis of ERβ1 cells showed a decrease in Runx2 expression (P < 0.01), whereas the expression of Runx2 increased in ERβ2 cells (P < 0.001). Data are mean values ± se, calculated using Student's t test. B, Western blot analysis of the Runx2 protein (50 μg of nuclear extract were loaded in each lane). β-Actin was used as a loading control. Runx2 expression decreased in the ERβ1 cells, but there was no reduction in the ERβ2 cells. C, qPCR analysis of the ERβ2 cells showed an increase in Slug expression (P < 0.03), whereas there was no significant change in ERβ1 cells. D, qPCR analysis of the 22Rv1 cells expressing ERβ2 also showed an increase in Slug expression (P < 0.034), whereas there was no significant change in ERβ1 cells. Data are mean values ± se, calculated using Student's t test. E, Western blot analysis of PC3 cells showed a small increase in Slug protein in ERβ2-expressing cells but no significant change in cells expressing ERβ1. F, Quantification of the Slug protein expression by ImageJ software (National Institutes of Health, Bethesda, MD). All the experiments were performed n = 3. GAPDH, Glyceraldehyde-3-phosphate dehydrogenase; ns, nonsignificant.

