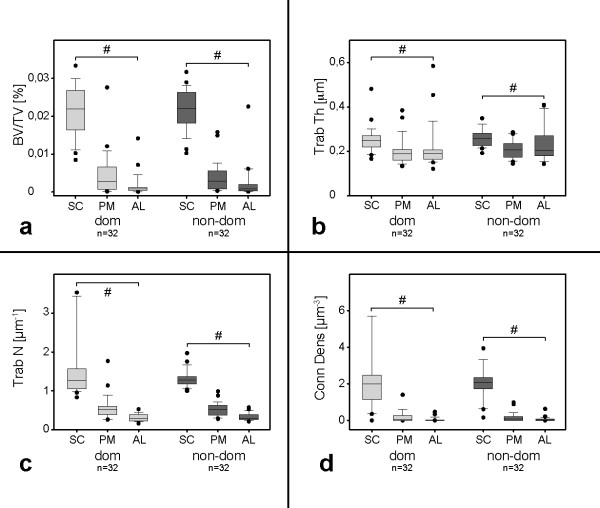
Figure 5.
Handedness analysis. Fig. a) presents results for BV/TV in [%], b) for Trab Th in [μm], c) for Trab N in [μm-1] and d) for Conn Dens in [μm-3]. Data for SC, PM and AL for the dominant (dom) side are depicted in light grey, for the non-dominant (non-dom) side in dark grey. Data are given as boxplots. # marks intra-group differences (p < 0.05).

