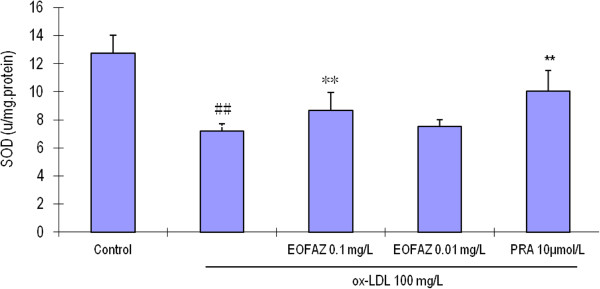
Figure 5.
Effects of EOFAZ on SOD activity in HUVECs exposed to ox-LDL. HUVECs treatment and cell lysate preparation were performed as described in Figure 3. SOD activity was measured by the xanthine/xanthime oxidase mediated ferricytochrome c reduction assay. The values shown are mean ± S.E.M. of three experiments (four or five cultures per experiment). ##p < 0.01, vs. control group; **p < 0.01, vs. ox-LDL group.

