Figure 1.

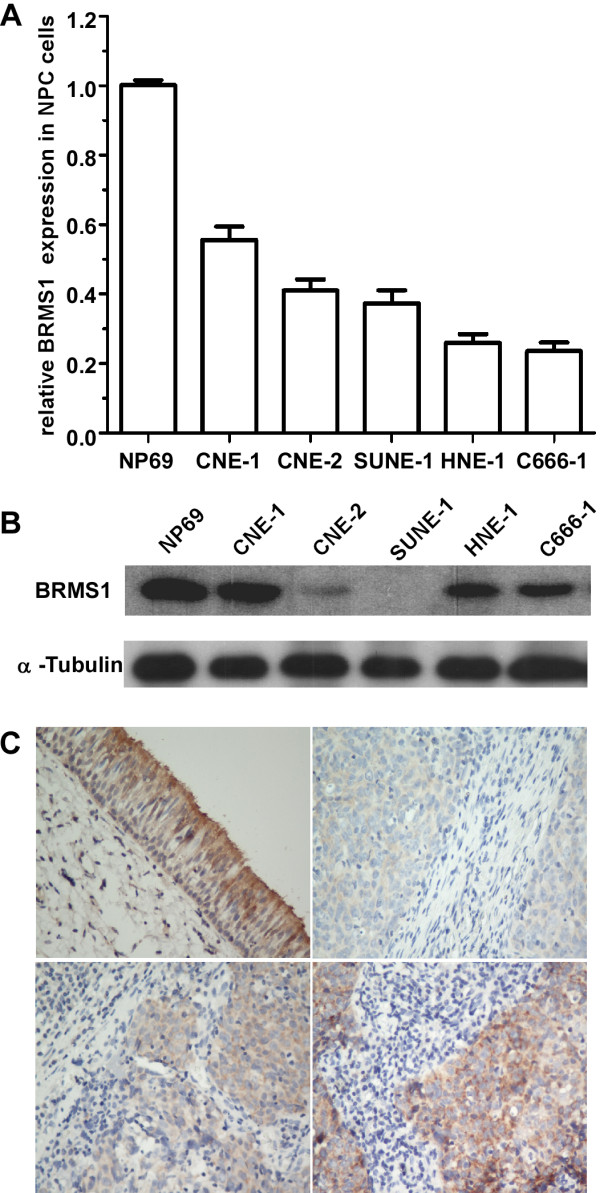
BRMS1 expression in NPC cells and tissues. Quantitative RT-PCR (A) and western blotting analysis (B) of BRMS1 mRNA and protein expression in parental NPC cells. Quantitative RT-PCR analysis of BRMS1 mRNA was normalized to glyceraldehyde 3-phosphate dehydrogenase (GAPDH). The quantitative RT-PCR data are represented as the mean ± SD (* p < 0.01; Student’s t-test). Equal protein loading was determined by α-tubulin in western blotting. (C) analysis of BRMS1 protein expression in NPC and noncancerous nasopharyngeal (NNP) tissues using immunohistochemistry ( IHC). The NNP tissue (upper left) showed strong BRMS1 staining. The NPC tissues showed various degrees of BRMS1 staining: weak (upper right), moderate (lower left) and strong (lower right) (magnification, 100×).
