
Figure 2.
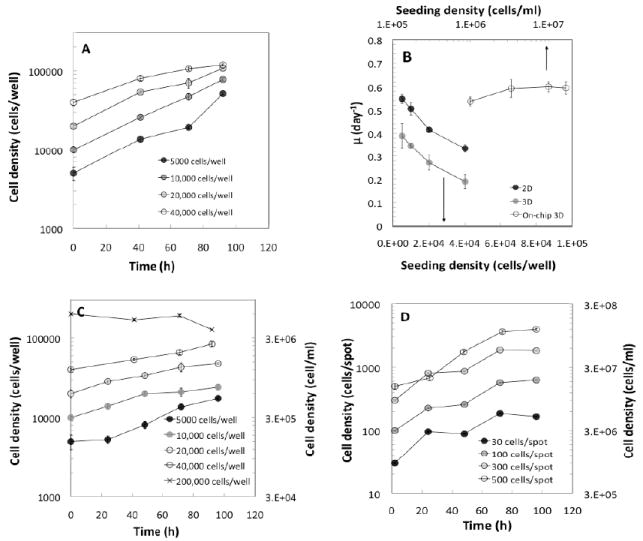
Comparison of cell proliferation in the three culture platforms. (A), (C), and (D) show the growth curves of cells in 2D, 3D, and on-chip 3D cultures, respectively, at various seeding densities. (B) Cell expansion as a function of seeding density. Seeding density is expressed as the number of cells per well for both 2D and 3D cultures in microtiter plates (lower x-axis), and as number of cells/ml for 3D cultures (upper x-axis).