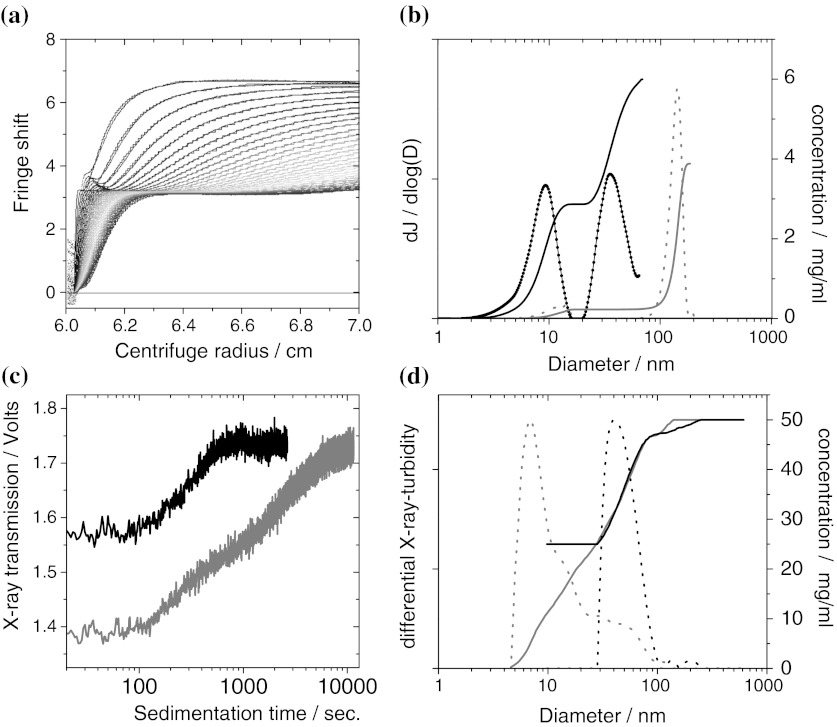
Fig. 2.
Validation of AUC on sub-100-nm SiO2 particles, showing raw data and evaluation for interference-AUC (upper row) and X-ray-AUC (bottom row). a Raw data and fit of interference-AUC on a 50/50 w/w mixture of Levasil 500 and Levasil 100, to highlight the direct reading of concentrations without any conversion. First scan at 162 s. after rotor acceleration, last scan at 2688 s., rainbow color code from blue to red. b Evaluation of the 50/50 w/w mixture of Levasil 500 and Levasil 100 (black solid line cumulative, black dashed differential) and of a 5 wt% spike of Levasil 300 with 95 wt% larger polymer beads (grey solid line: cumulative, grey dashed differential). The shares, the absolute concentrations and the diameters match the specified values. The signal from pure water is plotted, too (thick black line), but its noise level at 0.05 mg/mL is hardly visible. c Raw data of X-ray-AUC on a mixture 25 mg/mL Levasil 300 + 25 mg/mL Levasil 100 (grey line), and of 12 mg/mL Levasil 100 in the presence of 37 mg/mL polymer beads (black line). This highlights the selectivity of the X-ray-AUC for inorganic nanomaterial. d Evaluation of the X-ray-AUC raw data with the same color code. Note that the curve shapes are point-mirrored because larger particles sediment first and transformed by Eq. 1. (Color figure online)

