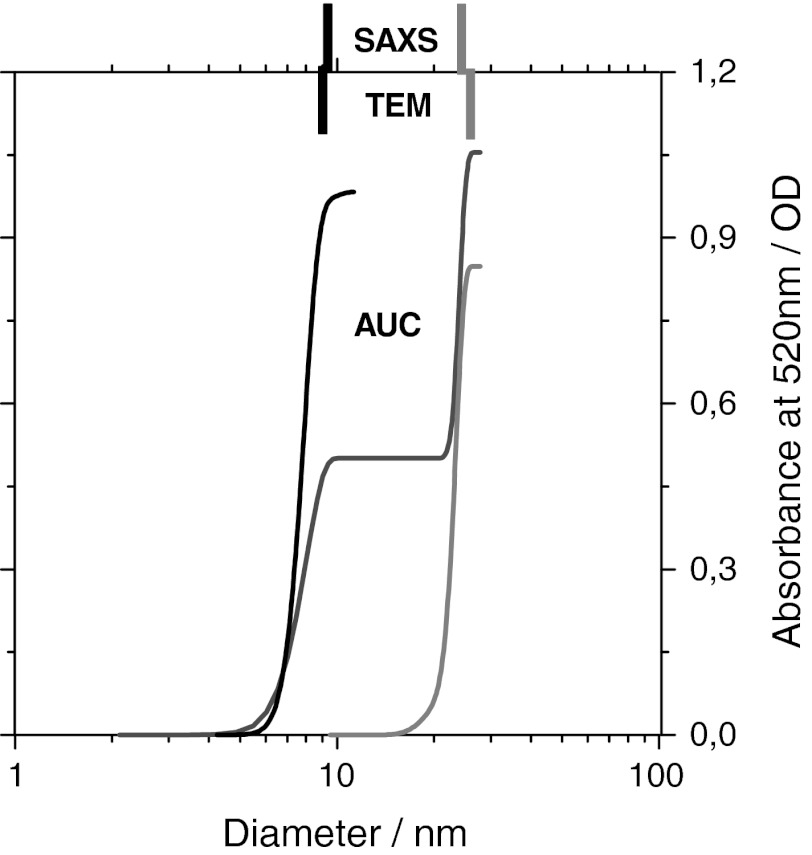
Fig. 3.
Analysis of NIST nano-gold reference materials. Cumulative size distribution of individual samples (Au 8011: black line measured at 5,000 rpm) (Au 8012: grey line measured at 3000 rpm) and their mixture (1:1 by suspension mass) (red line measured at 3,000 rpm). The specified values from SAXS and TEM are indicated as tickmarks in the respective colors. (Color figure online)

