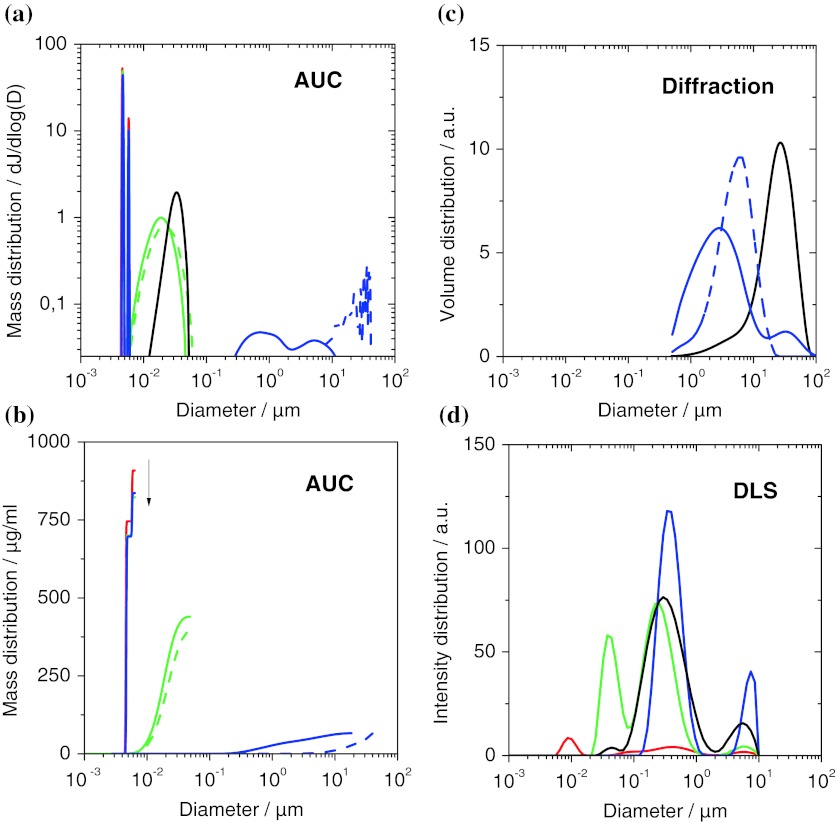
Fig. 7.
Comparison of in situ size distributions obtained on three representative materials: SiO2 (green), TiO2 (blue), mwCNT (black), pure PBS/BSA (red). a Differential representation of results from analytical ultracentrifugation (AUC). The peaks at 4.6 nm and 5.8 nm match the literature values of BSA monomer and dimer. Dotted lines indicate control experiments without BSA, leading to the disappearance of the peaks around 5 nm, and much stronger agglomeration of the TiO2 and CNT. b Cumulative representation of the same results to highlight the access to depletion data by quantifying the non-adsorbed proteins (arrow). Differential representation of results c from laser diffraction and d from dynamic light scattering (DLS). (Color figure online)

