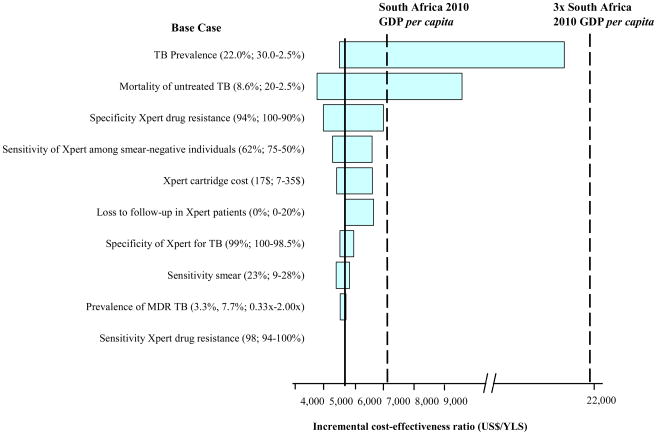
Figure 2. One-way sensitivity analysis of model parameters.
One-way sensitivity analysis comparing the impact of key model parameters on the incremental cost-effectiveness ratio (ICER) of the Xpert-2-all strategies, compared to the next best, non-dominated strategy. The x-axis is the ICER. Each horizontal bar represents a parameter varied over the range indicated; wider bars indicate larger differences in the ICER seen by varying the parameter. ‘x’ following a number denotes a multiplicative effect on the baseline value of parameter.
MDR: Multidrug-resistant; DS: Drug-susceptible; FLD: First-line drugs; SLD: Second-line drugs; YLS: year of life saved.

