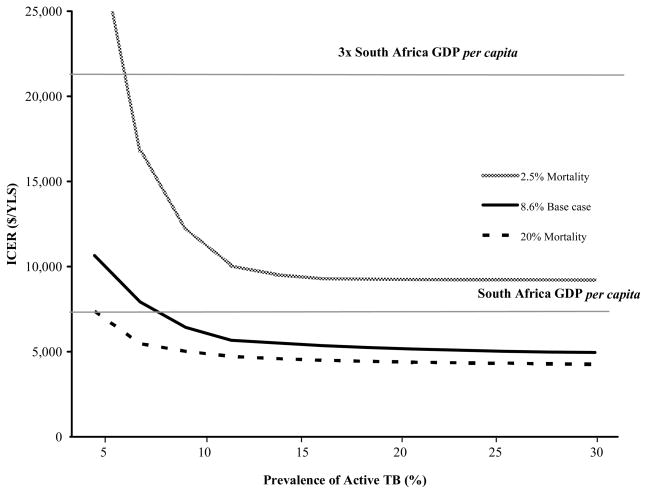
Figure 3. Two-way sensitivity analysis of TB prevalence and mortality of untreated TB on the incremental cost-effectiveness ratio (ICER) for Xpert.
The lower horizontal line indicates the 2010 per capita GDP of South Africa ($7,100), which the WHO defines as ‘very cost-effective’ (see Methods). The upper horizontal line indicates three times the per capita GDP of South Africa ($21,300), which is considered a ‘cost-effective’ intervention.

