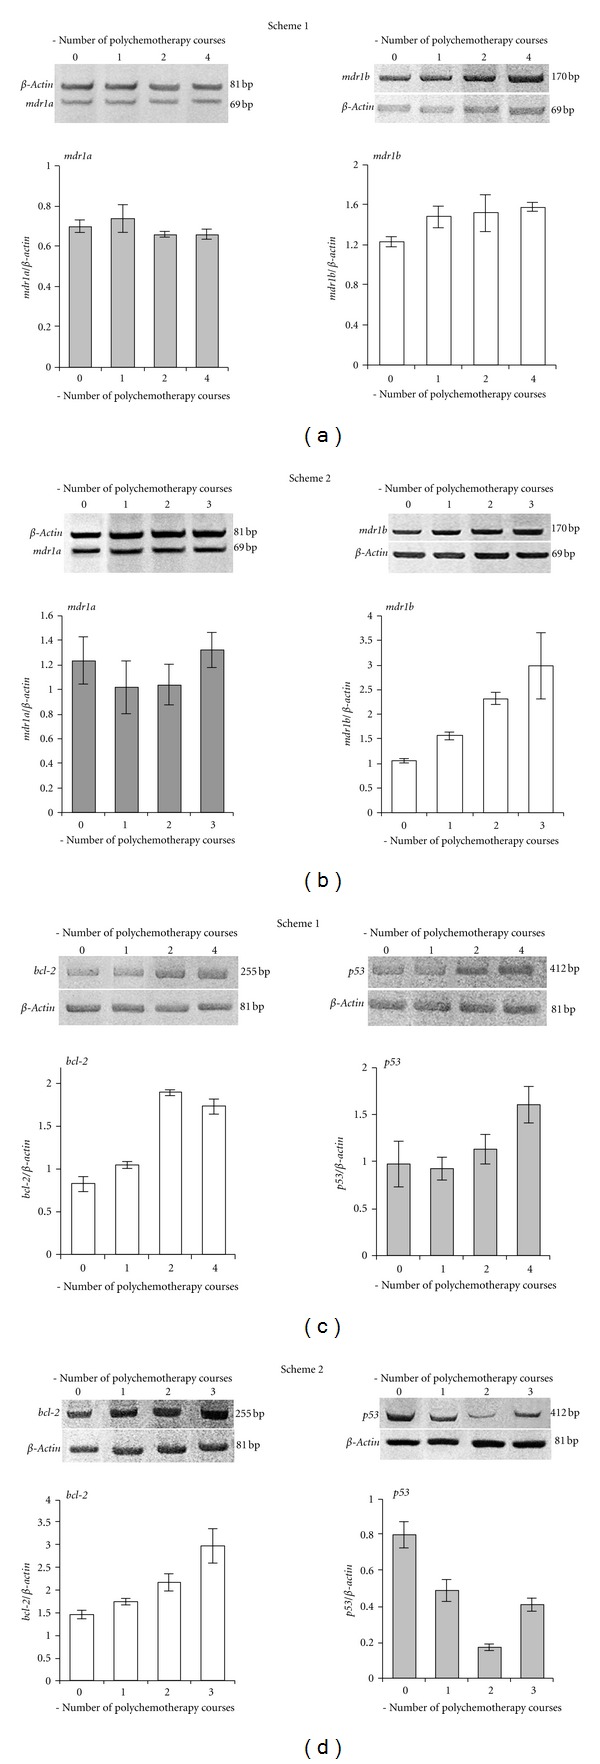
Figure 2.

Expression levels of mdr1a (a, b), mdr1b (a, b), bcl-2 (c, d), and p53 (c, d) genes in cells of primary culture RLS40 after the treatment of tumor-bearing animals, according to Scheme 1 and Scheme 2. Separation of RT-PCR products in 8% PAAG and quantification of the band intensities are shown.
