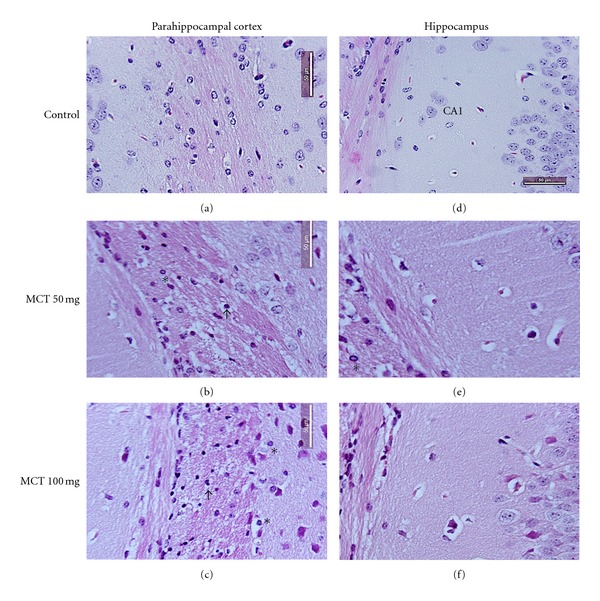
Figure 1.

Histologic analysis of representative parahippocampal cortex and hippocampus sections. Control mice showing normal brain tissue ((a) and (d)). MCT-induced severe structural disorganization, edema, moderate pyknotic cells (arrow), vacuolization (arrowhead), inflammatory cell infiltration (*) in parahippocampal ((b) and (c)), and hippocampus ((e) and (f)) regions in 50 and 100 mg/kg concentrations, respectively. H&E staining ((a), (b), (c), (d), (e), and (f) 400x).
