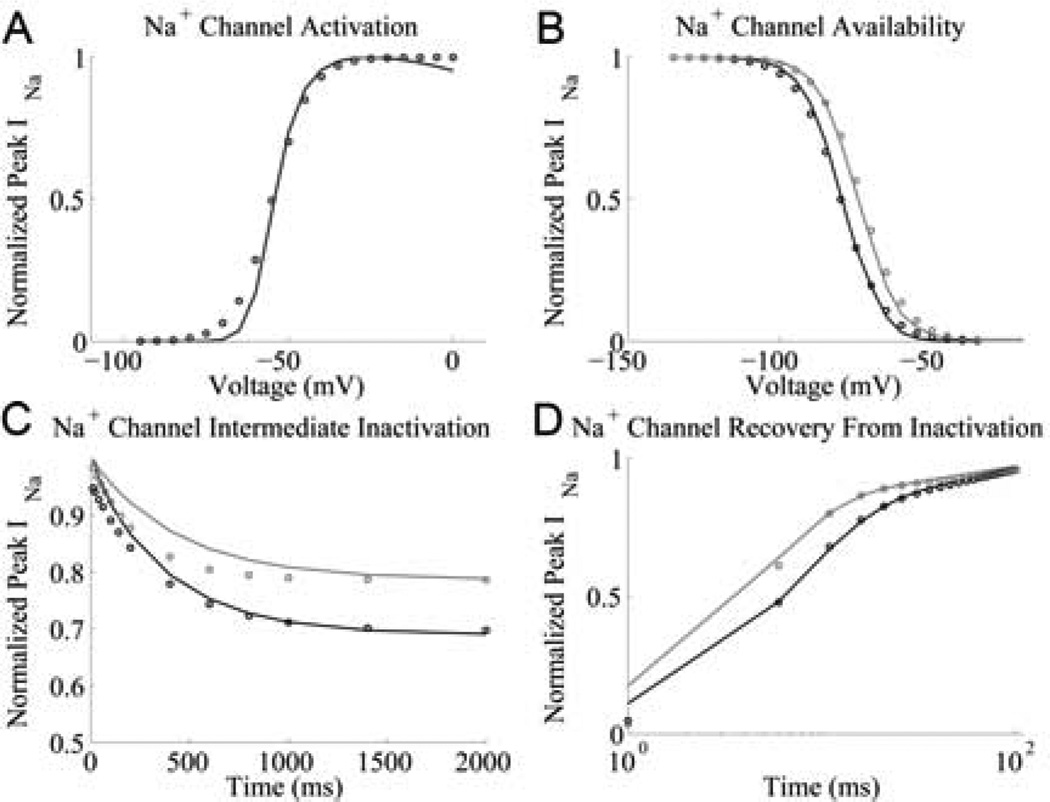
Fig. 1.
Na+ channel model simulation (solid lines) and experimental data (circles) [3] under phosphorylated (grey) and unphosphorylated (black) conditions. (A) Activation: INa is recorded during a 50 ms test potential from a holding potential of −120 mV. (B) Availability: a 500ms prepulse to a variable voltage is followed by a voltage clamp to −20mV, during which INa is recorded. (C) Recovery from intermediate inactivation: holding potential of −140 mV is followed by a variable duration prepulse to −20mV, during which INa is recorded. The membrane is then clamped to −140 mV for 20 ms and then to −20 mV for 50 ms, during which INa is recorded again. The ratio of peak INa (−20 mV vs. prepulse) is shown as a function of prepulse duration. (D) Recovery from inactivation: a holding potential of −140 mV is followed by a prepulse to −20mV for 300 ms, during which INa is recorded. The membrane is then clamped to −140 mV for a variable duration and then clamped to −20 mV for 50 ms, during which INa is recorded again. The ratio of peak INa (2nd vs. 1st pulse) is shown as a function of the interpulse interval.

