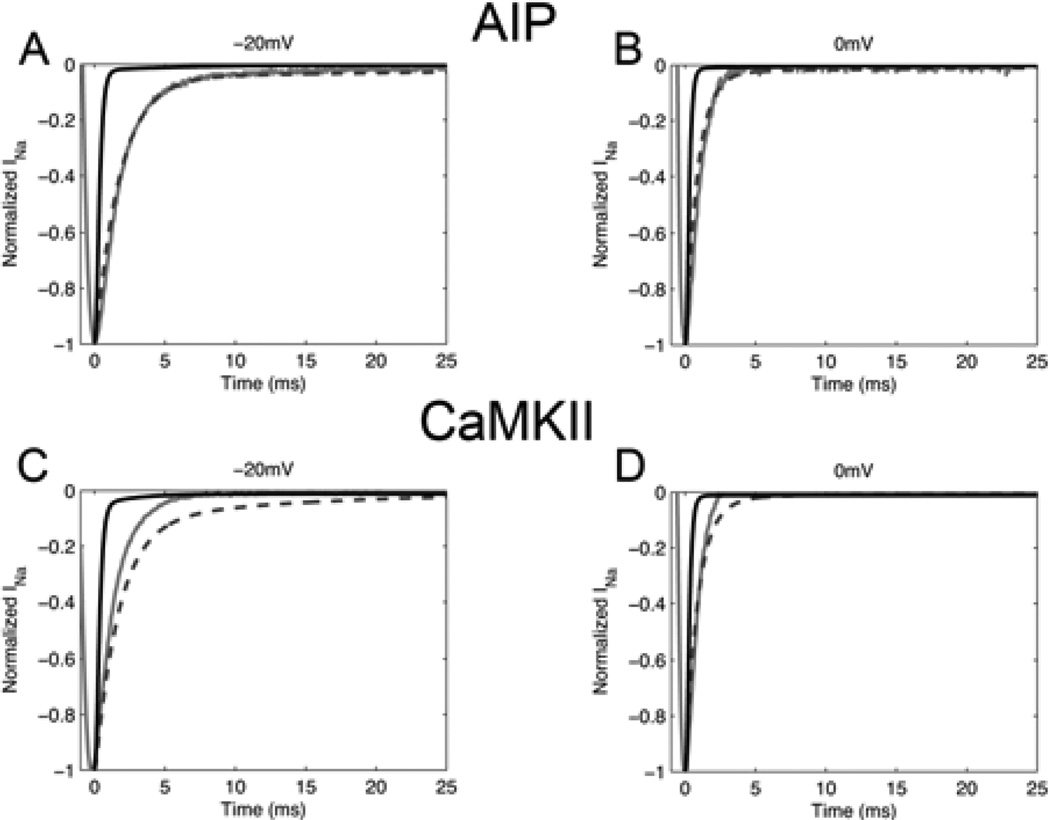
Fig. 2.
Simulated vs Experimental INa under voltage clamp. A 50 ms test clamp was applied from a holding potential of −120 mV. Experimental results [3] at 23°C in guinea pig myocytes (solid grey line) are compared with simulated INa at 23°C (dashed line) and 37°C (solid black line). INa is shown in the presence of CaMKII inhibitor AIP at −20 mV (A) and 0 mV (B) and in the presence of CaMKII at −20 mV (C) and 0 mV (D).

