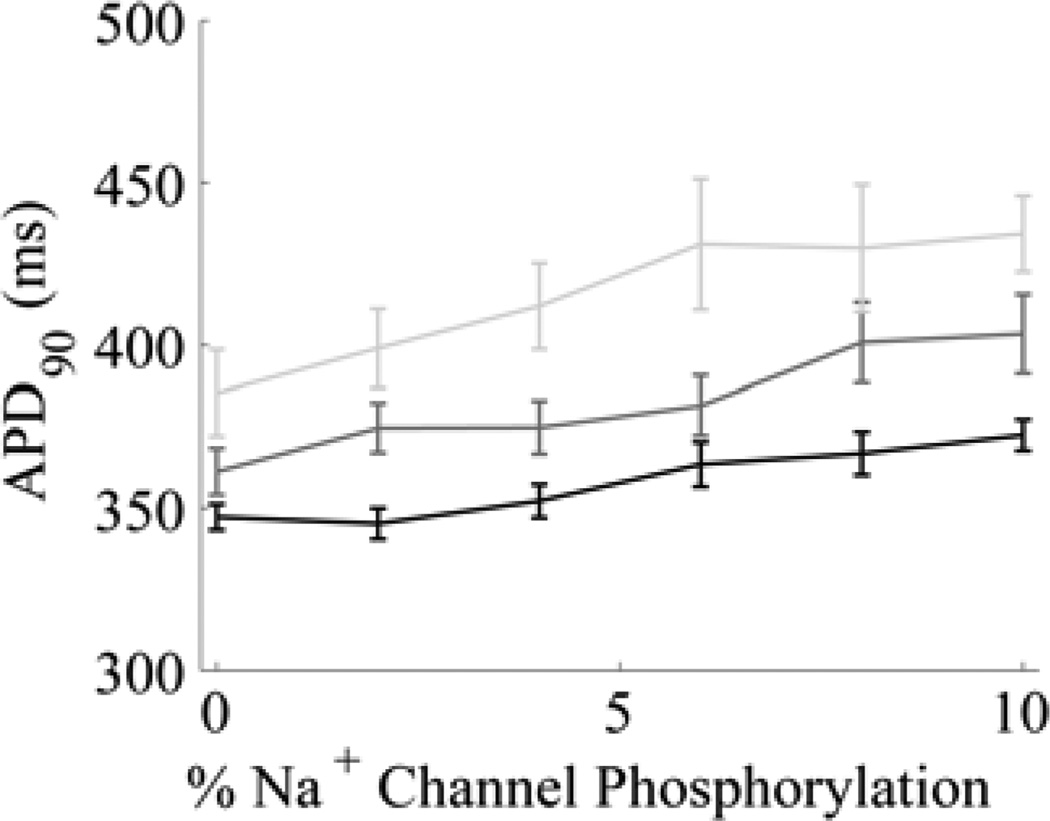
Fig. 4.
APD as a function of LCC and Na+ channel phosphorylation (1-Hz pacing). Mean APD90 ± S.E.M. is shown (n = 30). Black: reduction of LCC phosphorylation rate to 60% of control (~1.4% LCCs phosphorylated); dark grey curve: reduction of LCC phosphorylation rate to 80% of control (~2.5% LCCs phosphorylated); light grey curve: control LCC phosphorylation rate (~3.9% LCCs phosphorylated).

