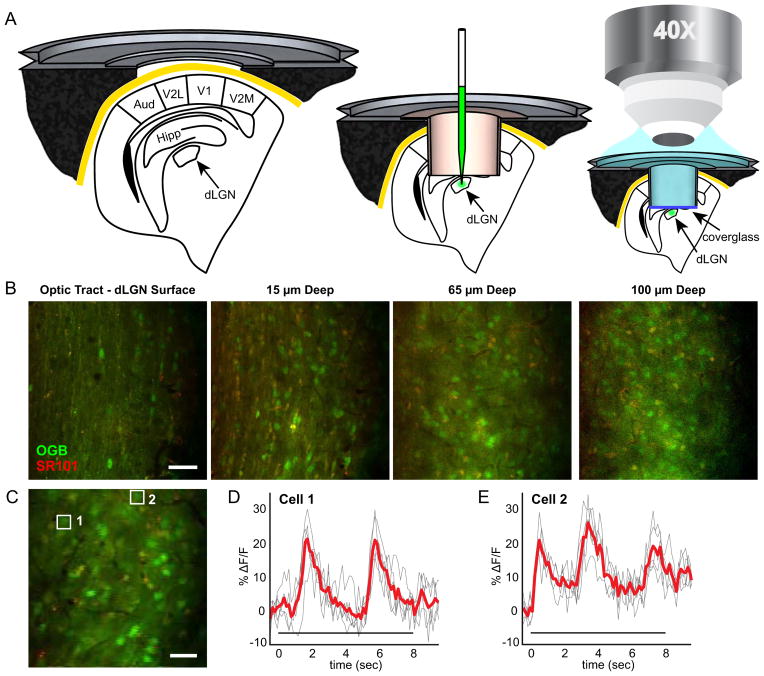
Figure 1. Two-Photon Calcium Imaging of Visual Responses in the Mouse dLGN.
(A) Surgery and calcium dye loading procedure as described in Experimental Procedures. Metal frame and tube cross sections, as well as anatomy (Paxinos, G. and Franklin, K. B. J., 2001) are drawn to scale. The microscope objective drawing is not to scale. (B), Images at multiple depths in the dLGN (Movie S1). Lateral is up, anterior is right. (C), Example field of view used for imaging visual responses. (D–E), Change in fluorescence over time (ΔF/F) for neurons indicated by white boxes in (C). Cell 1 (F1 = 7.6 ± 0.4% F/F) responds after Cell 2 (F1 = 5.9 ± 0.7% F/F) indicating slightly shifted positions of their receptive fields relative to the same grating stimulus. Fourier magnitude is unaffected by these shifts in phase (Figure S1). Red line indicates mean over five trials; each trial is a gray line. Stimulus time indicated by bar under waveforms. Scale bars: (B), 50 μm (C), 25 μm.

