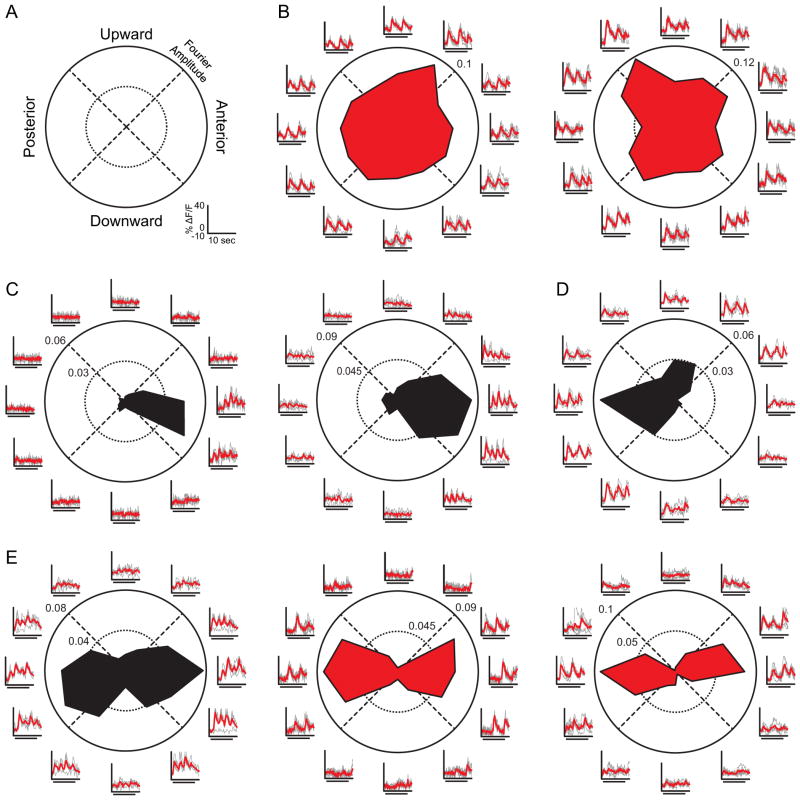
Figure 2. Direction and Axis Selectivity in the dLGN.
(A), Polar plot legend for (B–E), with directions in visual coordinates. Scale bars for fluorescence change (ΔF/F) and time in (B–E) are shown in lower right. (B–E) Examples of non-direction-selective dLGN neurons (B), anterior DS neurons (C), posterior DS neuron (D), and axis-selective neurons (E). Polar plots represent the magnitude of F1 (red) or F2 (black, On-Off) response to each grating direction. Axes outside of the circle show the fluorescence time series, in units of percent change in fluorescence, in response to each direction of the grating. Individual trials (gray) are overlaid with the mean time series (red), where stimulus time (8 seconds) is indicated by bar under waveforms as in (Figure 1D–1E).

