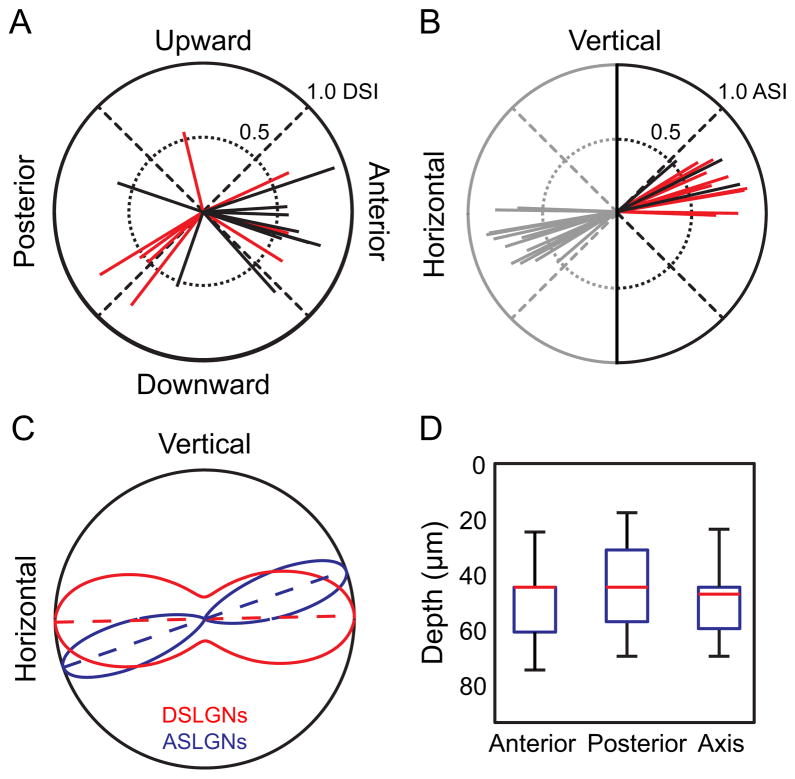
Figure 3. The Superficial dLGN is Selective for Horizontal Motion.
(A), Each vector on polar plot indicates a DS neuron. Direction of vector indicates direction preference. (B), Each vector indicates an axis-selective neuron. Direction of vector indicates axis preference. Vectors are reflected (gray) for display purposes, and represent the same data as black and red vectors. (A–B), Length of vectors indicates level of direction selectivity (DSI) or axis selectivity (ASI), using the max-null metric (Supplemental Experimental Procedures). Data for all neurons in the dataset are shown in Figure S2, using the resultant metric and the Hotelling T2 test, for all values of DSI and ASI. Black lines indicate On-Off response (F2 modulation) and red lines indicate F1 modulation. (C), Maximum likelihood fit of axial circular Gaussian distributions to the observed populations of direction- and axis-selective neurons from (A–B). Curves represent the axial Gaussian model’s probability of observing a direction- (red) or axis-selective (blue) neuron with a given preferred direction or preferred axis. Dotted lines indicate preferred axis for each population, and curves are normalized to equalize the maximum probability density for visualization. Both populations prefer axes representing horizontal motion. (D), Depth of neuron populations in dLGN dataset depending on stimulus selectivity. Whiskers are complete depth range, boxes are 25th to 75th percentile, and the red line is the median depth. Anterior-, posterior- and axis-selective neurons overlap locations in depth within the superficial ~75 μm of dLGN.

