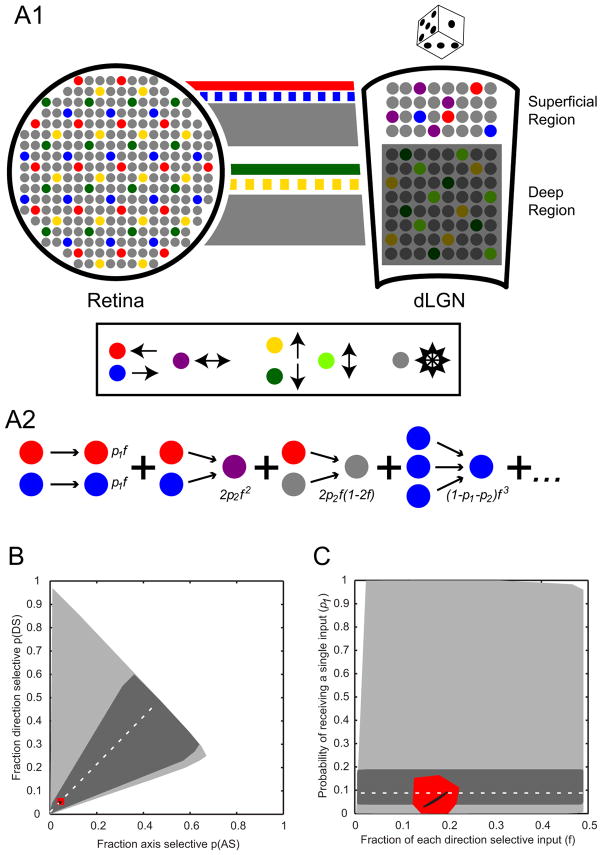
Figure 4. Wiring Model Between Retina and dLGN.
(A1) (Left) Schematic representation of mosaics of retinal ganglion cells. Each color represents a different On-Off DSRGC cell type: posterior (red), anterior (blue), upward (yellow), downward (green). Non-direction-selective neurons are gray. (Right, “Superficial Region”) Organization of dLGN showing the superficial dLGN region containing intermingled populations of posterior (red) and anterior (blue) DSLGNs as well as horizontal ASLGNs (purple) and non-direction-selective neurons (gray) as revealed by the current study. (Right, “Deep Region”) Predictions for deeper dLGN, including intermingled upward (yellow) and downward (green) DSLGNs as well as vertical ASLGNs (light green). This region is grayed out because its functional organization remains unknown. Lines between retina and dLGN schematics represent RGC axons. Color conventions are same as rest of figure. The thickness of the lines indicates predicted fraction (f) of overall input from our random wiring model. Solid red and green lines represent known projection patterns of posterior and downward DSRGCs, respectively, whereas dashed blue and yellow lines represent predicted projection patterns of anterior and upward DSRGCs made by the current study. Our random wiring model demonstrates that concentrated, laminar projection patterns of opposing DSRGCs can yield the fractions of DSLGNs and ASLGNs we observe in superficial dLGN given locally random wiring. (A2) Basic probabilistic theory of the model which assumes dLGN neurons receive one (probability = p1), two (p2) or three inputs (1-p1-p2) from retina that drive their selectivity, including a variable for the fraction of anterior and posterior direction selective input (2f). Some examples of individual probabilities are shown (see Table S1 and Supplemental Experimental Procedures). (B, C) Results of the model. (B) All possible ASLGN and DSLGN fractions based on the model without further constraints (light gray area). The fraction of purely single input neurons from Cleland et al., (1971a) (95% binomial C.I. from Wilson interval: dark gray area 0.038 < p1 < 0.19, actual value: dotted line p1 = 0.088) constrains the plausible range of ASLGNs and DSLGNs. The observed fractions of ASLGNs and DSLGNs in our study (95% binomial C.I. from Wilson interval: red area 0.026 < ASLGN fraction < 0.069, 0.033 < DSLGN fraction < 0.079, actual value: black dot ASLGN fraction = 0.043, DSLGN fraction = 0.051) falls within this plausible range. (C) Possible p1 and f values (by varying across all values of p2) corresponding to the differing constraints in (B): unconstrained model (light gray region), constraining p1 to be consistent with the fraction of purely single input neurons from Cleland et al (1971a) (95% C.I.: dark gray region, actual value: dotted line), or constraining the model to be consistent with the experimentally observed ASLGN and DSLGN fractions in this study (95% C.I.: red region, actual value: black curve).

