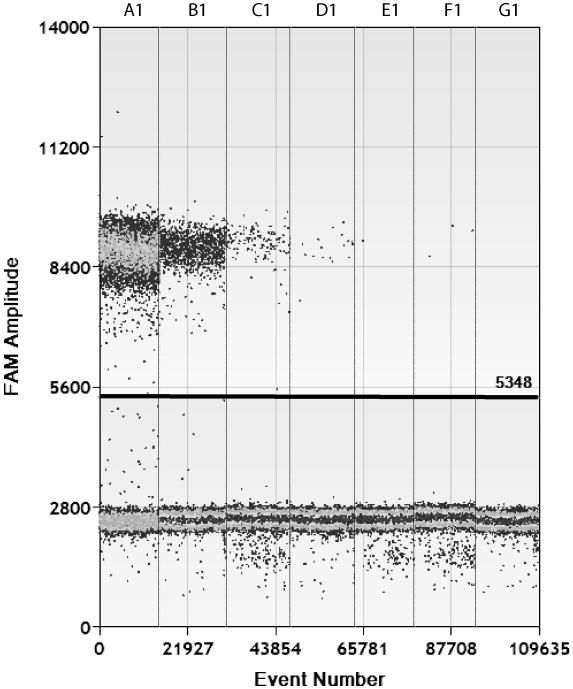
Figure 1.
Visual representation of ddPCR results for HIV-1 DNA standards after flow enumeration. Positive droplets (upper cluster) and negative droplets (lower cluster) are shown for 6 serially diluted linear DNA standards (A1 through F1) and negative control (G1). The Y axis represents fluorescent intensity and the X axis is the total number of events for each standard dilution. The manually set threshold for droplet positivity is represented by the horizontal line.

