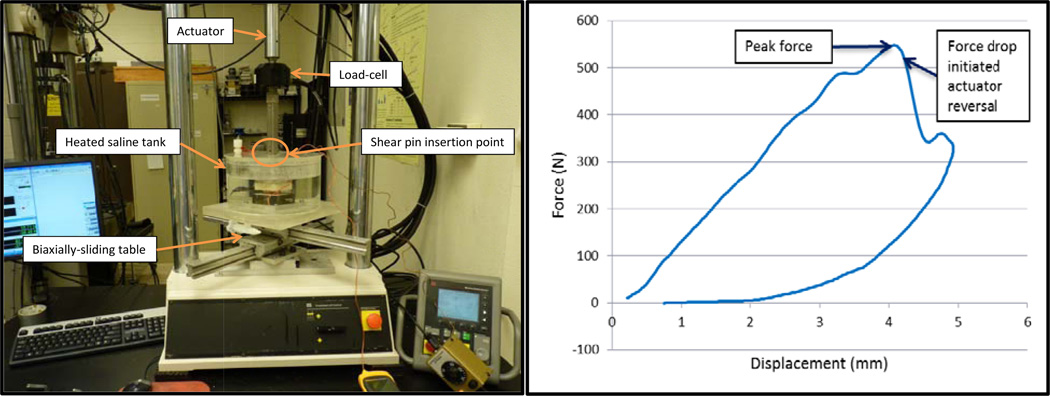
Figure 1.
(Left) The ligament tensile-testing apparatus. (Right) A typical damage step force/displacement curve at 50 mm/s loading. It can be noted that displacement continued to briefly increase after the force drop before the actuator decelerated and reversed, indicating system lag (average of 23 milliseconds).

