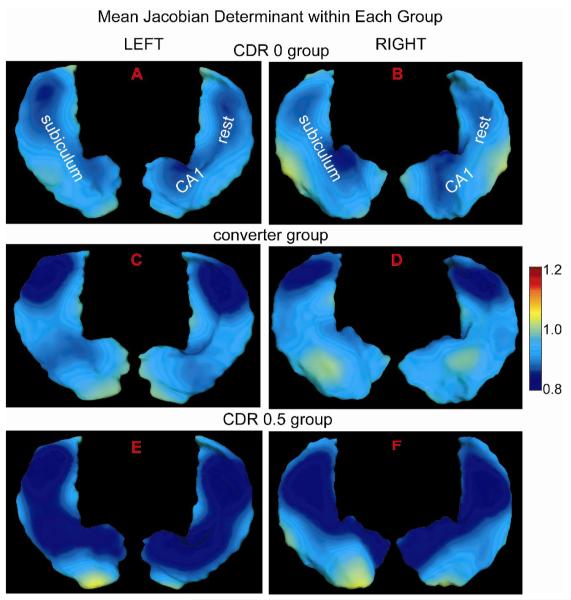
Fig. 4.
Figure shows Jacobian determinant of the deformation between the baseline and its follow-up surfaces averaged over each clinical population in the global template coordinates. Panels (A, C, E) illustrate those for the left hippocampus, while panels (B, D, F) show those for the right hippocampus. The bottom and top views of the hippocampus are respectively shown in the left and right sides of each panel (see the reference of subfield divisions in Figure 3).

