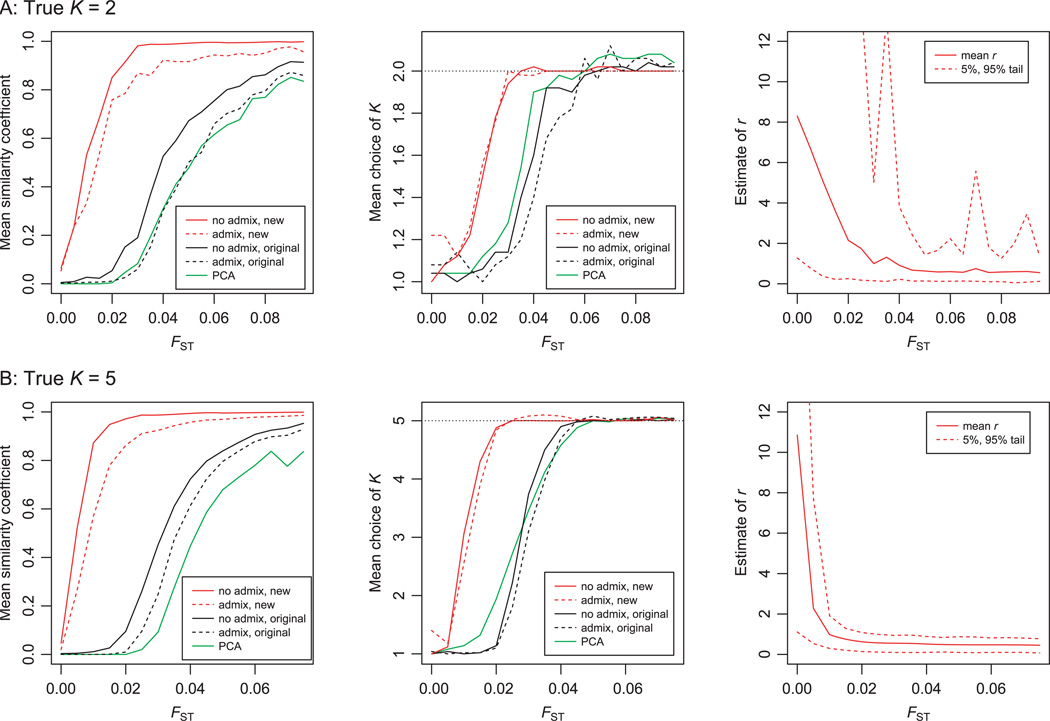
Figure 1.
Results for simulations without admixture. Data were simulated for K = 2 and K = 5, as described in the Methods. On the left is plotted the mean similarity coefficient between the true and estimated ancestry, as a function of FST, each averaged over 50 simulated data sets. The middle plots show the average choice of K, with the dotted horizontal lines indicating the true value of K. On the right, the solid line shows the average estimate of r calculated using the new no-admixture model with sampling locations. The dotted lines show the 5% and 95% tails of the distribution.

