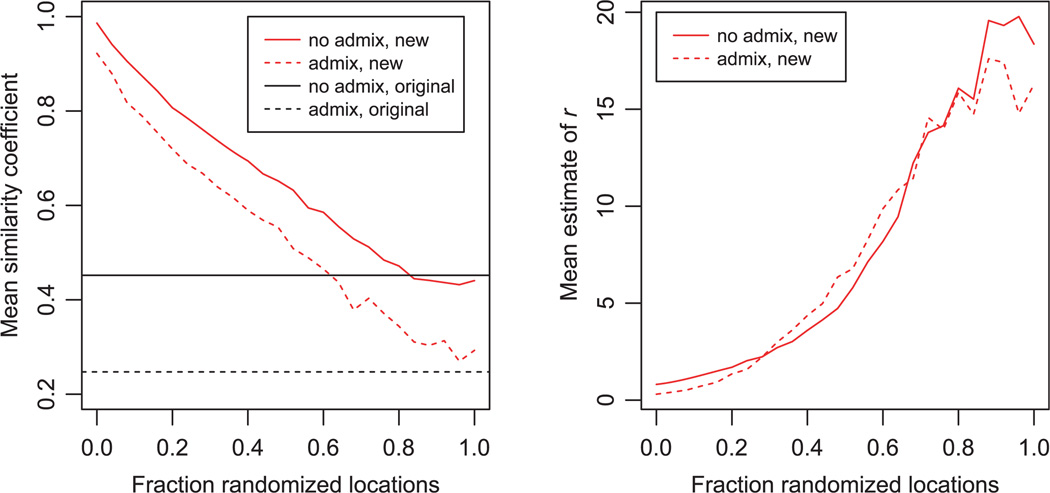
Figure 4.
Effect of varying the amount of information contained in the location data. The simulations assumed 250 individuals, five sampling locations, K = 5, FST = 0.03, and no admixture. The x-axis shows the fraction of individuals whose location data were randomized. For all other individuals, the location number matched the true population number.

