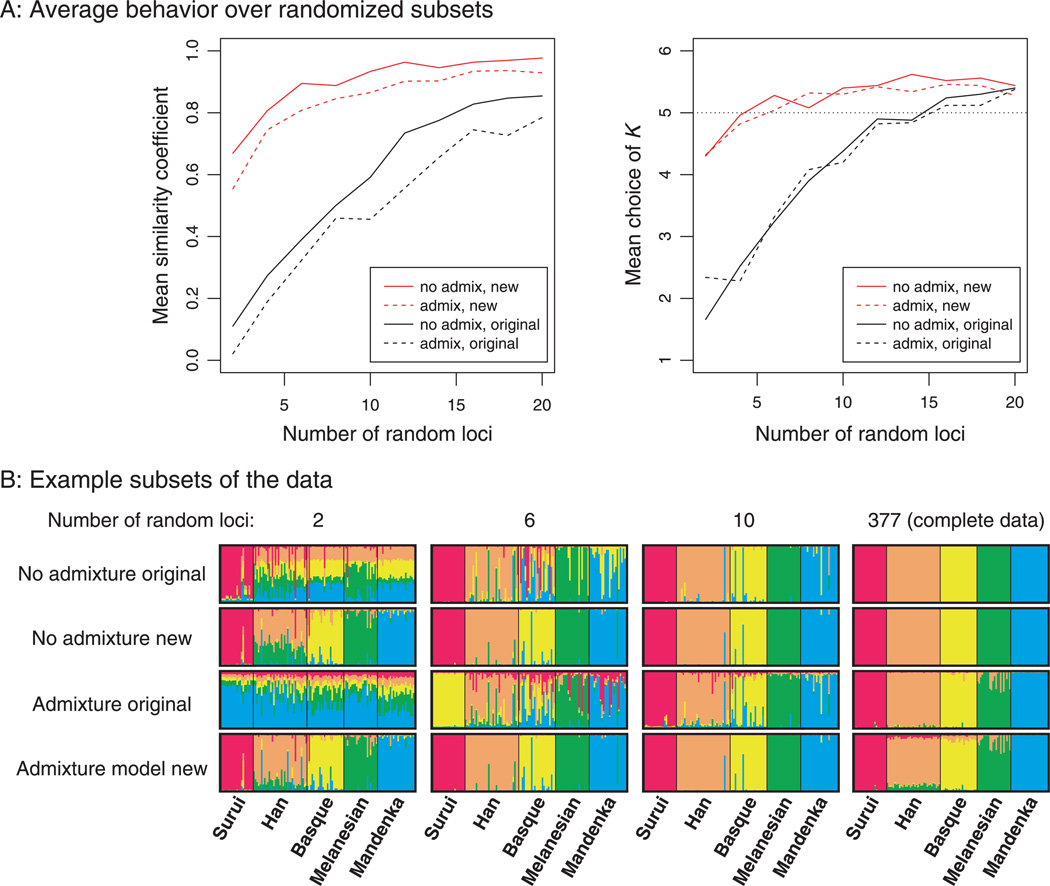
Figure 5.
Analysis of five populations from the Human Genome Diversity Panel microsatellite data set. In Fig. 5A, the mean similarity coefficient and choice of K are plotted, averaged over 50 runs using a number of randomly chosen microsatellites, shown on the x-axis. Figure 5B shows Structure results for the first 2, 6, and 10 loci, as well as the entire data set.

