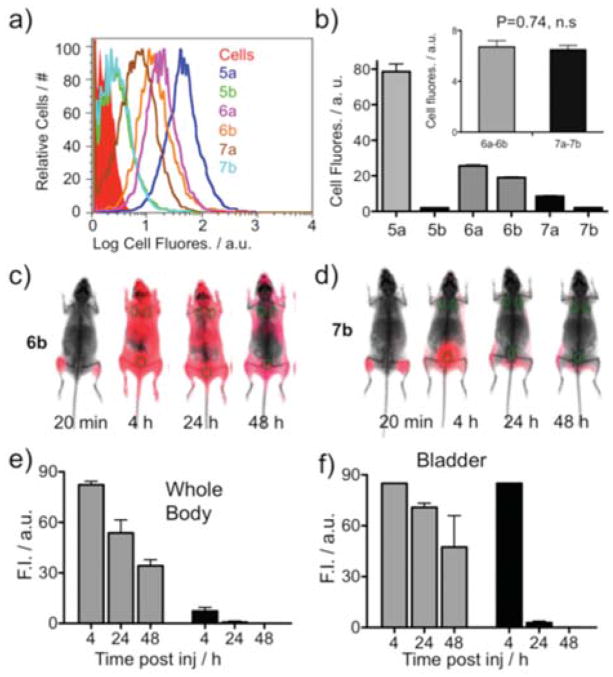
Figure 3. Effect of PEG on the specific and non-specific binding to cells and on probe elimination.
Cell fluorescence (BT-20 cells) after incubation with the six fluorochrome bearing peptides from Figure 1c was determined by FACS as shown in (a), with peak fluorescence tabulated in (b). (c, d) Whole body surface fluorescence of mice after 6b (RAD control, unPEGylated) or 7b (RAD control, PEGylated) injection at 1 nmole/site. Circles are the regions of interest used to quantify whole body (e) or bladder (f) surface fluorescence. (e) Quantification of whole body surface fluorescence of 7 mice. Gray bars for 6b or black for 7b. (f) Quantification of bladder fluorescence for 7 animals.

