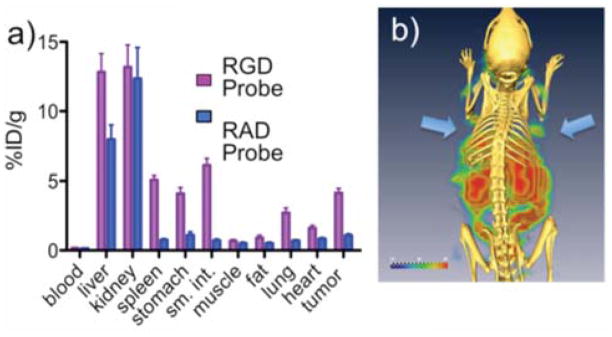
Figure 4.
In vivo integrin targeting using the PEG-Fluorochrome Shielded RGD probe (7a) and RAD (7b) probe. a) Tissue concentrations of 111In labeled 7a and 7b. Numerical data are presented in the Supplement, Table S2. b) SPECT-CT image of 7a. Arrows indicate dual BT-20 tumors. Data are at 24 h post i.v. injection.

