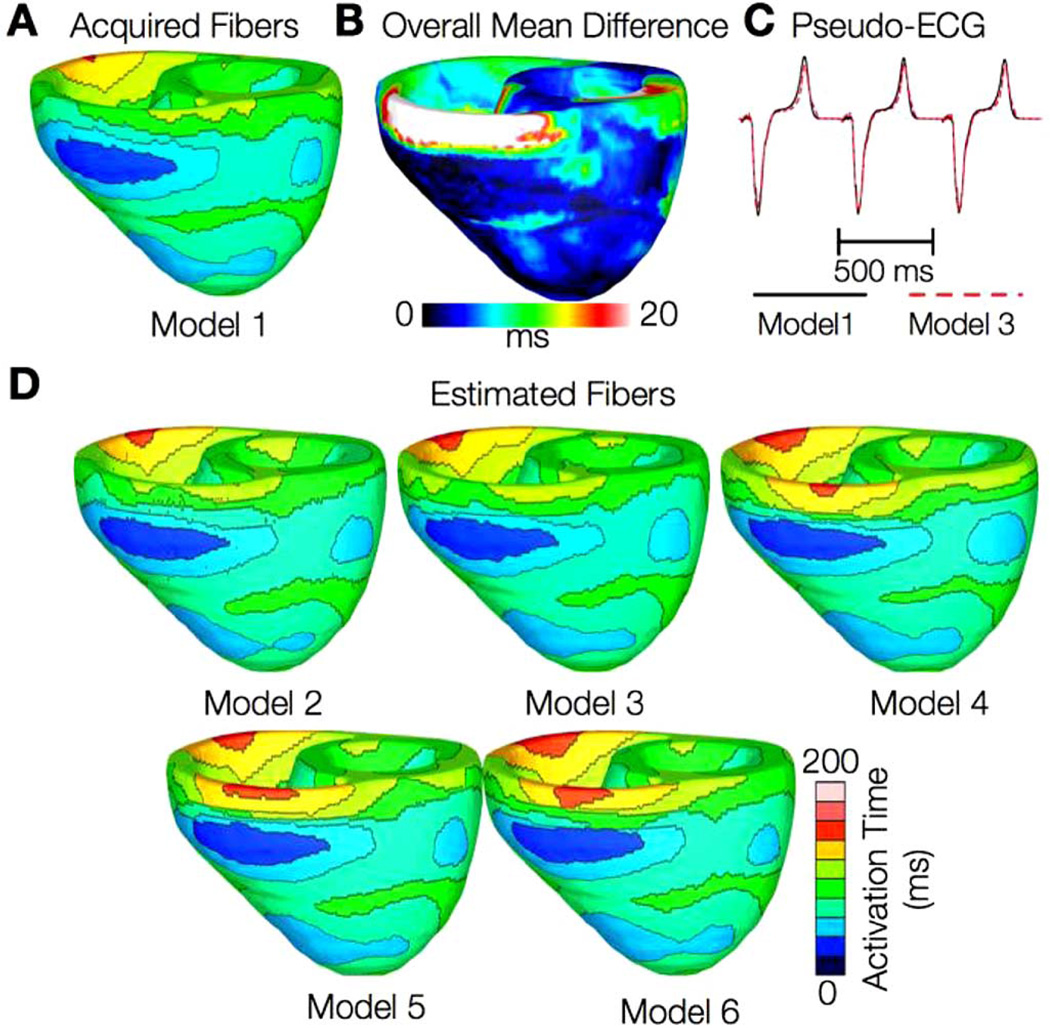
Fig. 5.
Results from simulations of one beat of sinus rhythm in normal canine ventricular models. (A) Activation map simulated using the model with acquired fiber orientations (model 1). (B) Absolute difference between simulated activation maps obtained from a ventricular model with acquired fiber orientations and that with estimated fiber orientations, averaged over the five estimates. (C) Simulated pseudo-ECGs with models 1 and 3. (D) Simulated activation maps from ventricles with estimated fiber orientations (models 2–6).

