
Figure 4.
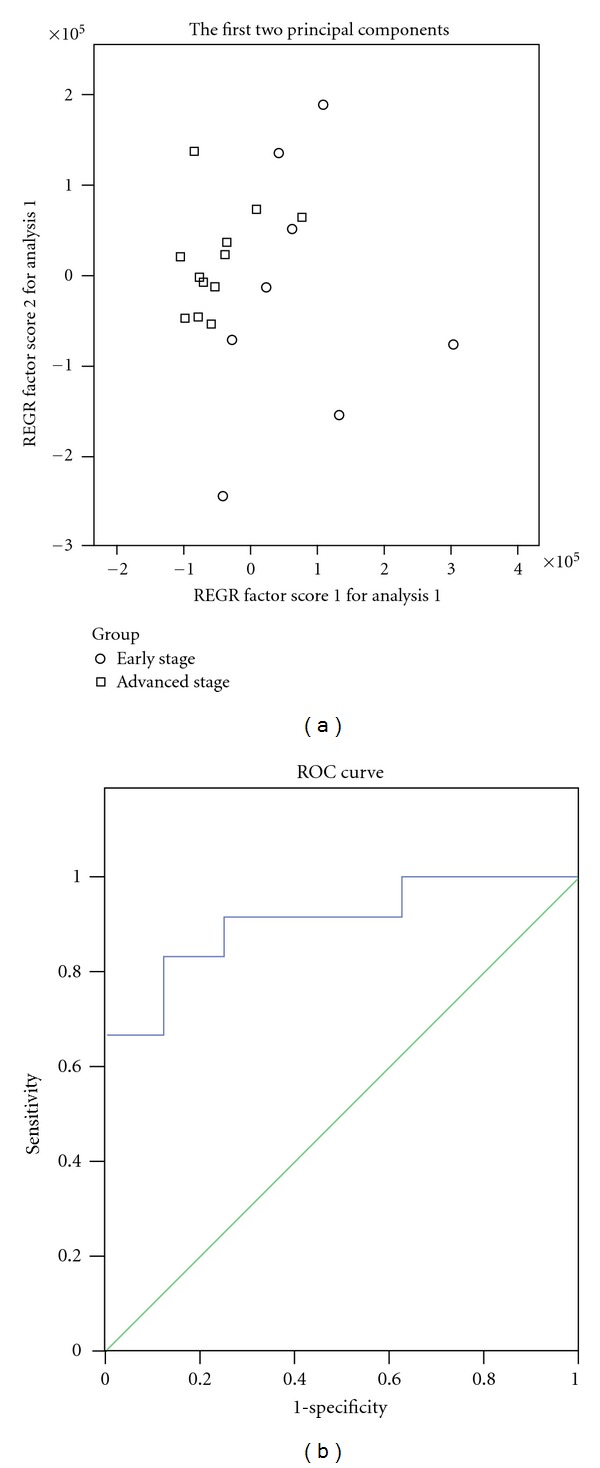
Principal component analysis model and receiver operating characteristic curve for advanced colorectal cancer. (a) Principal component analysis (PCA) scores plot of early stage group and advanced group based on 2 marker metabolites. The PCA scores plot showed that the samples from early stage group and advanced group were scattered into two different regions; (b) receiver operating characteristic (ROC) analysis was performed using the values determined by the first two principal components. Area under the curve (AUC) = 0.906.