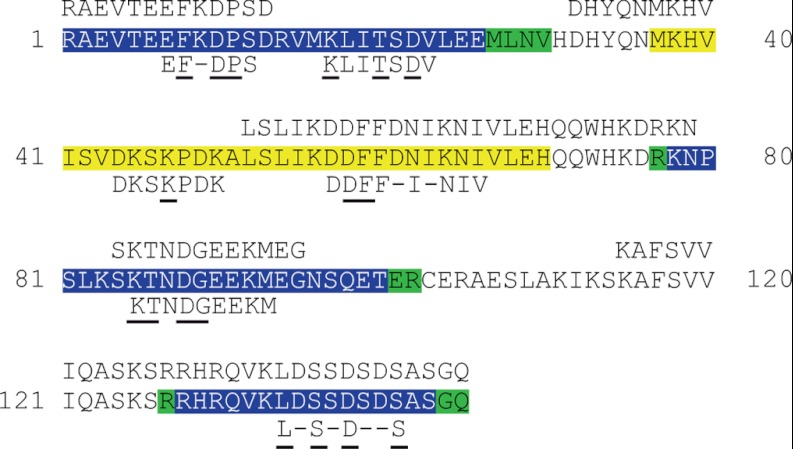
Fig. 6.
The specificity of anti-PrEST polyclonal antibodies directed against SNAPC1 analyzed using different approaches. The top line indicates the peptide sequences identified via bacterial surface display. The center line contains the entire PrEST sequence representing the SNAPC1 protein, and the color encoding indicates the strength of the reactivity of the antibodies as detected in the peptide arrays by a 15-mer length scan with an offset of 1 (from Fig. 2B; blue, green, and yellow indicate strong, intermediate, and weak reactivity, respectively). The bottom line indicates the peptide sequences identified by the heat map approach (underlined residues indicates highly selective positions; dashes indicates nonselective interaction within an epitope).

