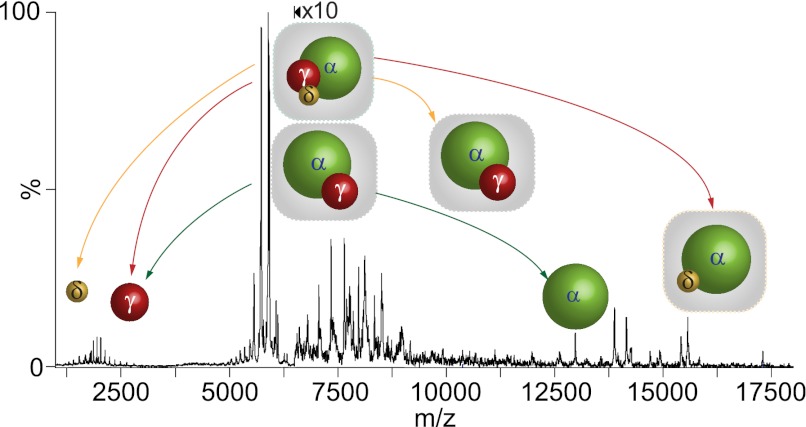
Fig. 3.
Nanoelectrospray tandem mass spectrum of PhK in 10% v/v ammonium hydroxide obtained from mass selection of αγδ and αγ subcomplexes at 5916 m/z. Because of the proximity of their subcomplex mass series, both the αγδ trimer and the αγ dimer were isolated for analysis by CID. The two CID pathways detected for αγδ are shown by red and yellow arrows depicting, respectively, asymmetric ejection of γ and δ to form stripped αδ and αγ subcomplexes. The CID pathway of dissociation for αγ is depicted by green arrows.

