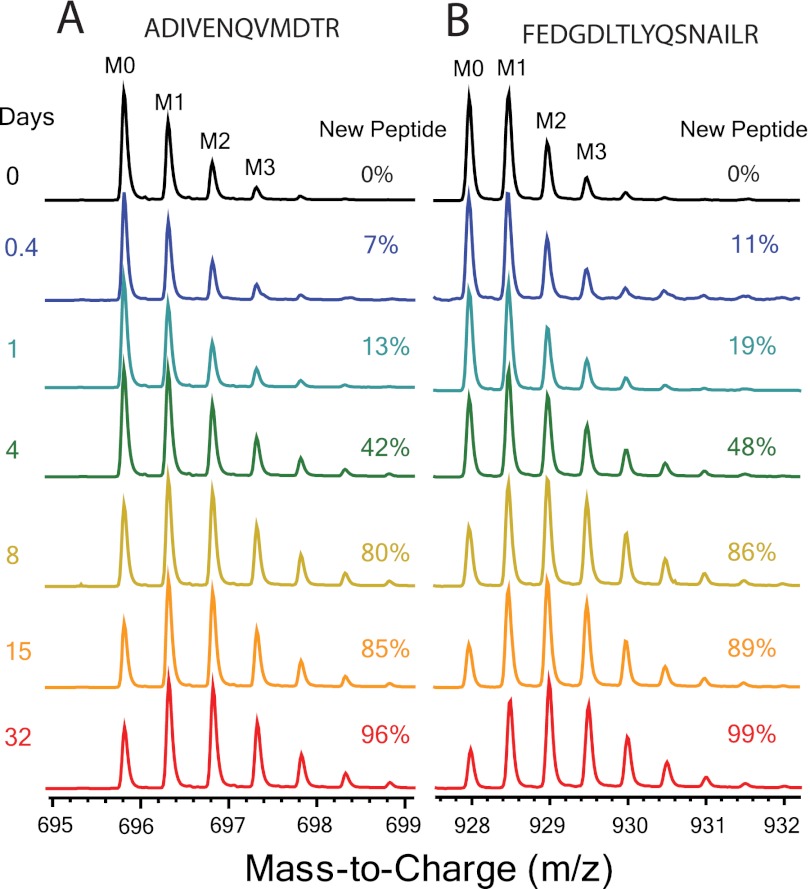
Fig. 2.
Endogenous kinetic labeling. Sample spectral data showing the incorporation of 2H over time in glutathione S-transferase Mu 1 tryptic peptides: A, FEDGDLTLYQSNAILR; B, ADIVENQVMDTR. At each time point the spectral contribution from the population of newly synthesized peptide (fraction new peptide, or f) can be calculated. This isotopically labeled population of peptide has a very different isotope pattern, with the intensity of heavy isotopic masses increasing relative to the monoisotopic peak (M0) intensity.

