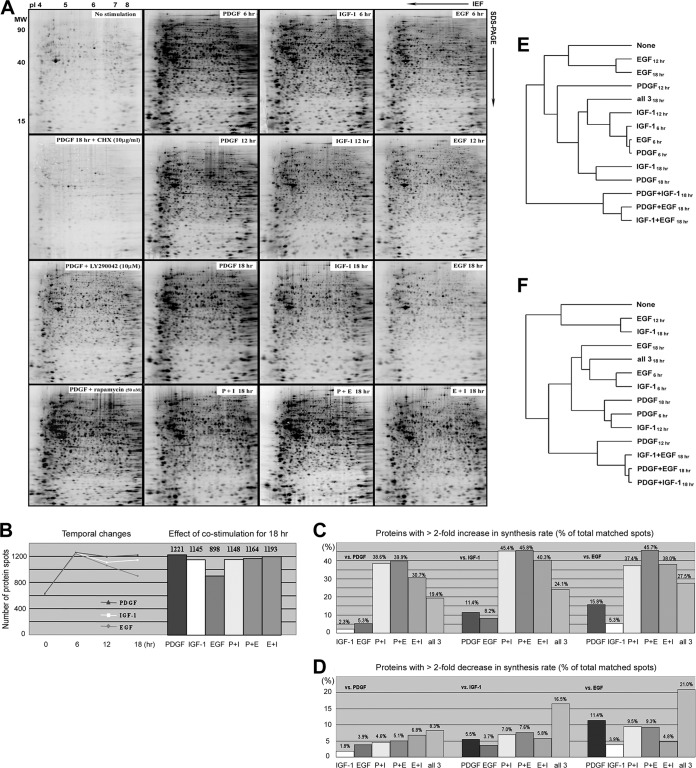
Fig. 2.
A, Global analysis of protein synthesis in Swiss 3T3 cells stimulated with PDGF, IGF-1, EGF, and their combinations. Newly synthesized [35S]methionine- and cysteine-labeled proteins were separated on broad range, nonlinear (pH 3–10NL) IPG/PAGE gels. Radiolabeled proteins were detected by phosphoimaging. The elevated de novo synthesis in PDGF-stimulated cells was blocked by cycloheximide. Note the profound reduction in protein synthesis in cells where long-term PDGF treatment (18 h) was performed in the presence of the PI3K inhibitor LY290042 (10 μm). B, Number of 2DE protein spots detected in extracts from cells treated with PDGF, IGF-1, EGF, and their combinations. Left; temporal changes in the number of [35S]-labeled protein spots detected following 6, 12, and 18 h stimulation. Right; numbers of radiolabeled proteins detected following 18 h of stimulation. Numbers are the average taken from three independent experiments. C, Comparison of the number of matched protein spots showing a >twofold increase in 35S-incorporation between different GF treatments at the 18 h time point. Values were calculated as a percentage of total matched protein spots and compared the synthetic responses to growth factors and their combinations to those generated by individual growth factor stimulations. The analysis provides an indication of the comparative potency of each GF in stimulating or suppressing protein synthesis. D, Comparison of the number of matched protein spots showing a >twofold reduction in 35S-incorporation between different GF treatments at 18 h. E, Hierarchical clustering analysis of protein synthesis in GF-stimulated cells. Two-dimensional gel images of biosynthetic labeled proteins were clustered according to similarity between the density patterns of a group of 172 proteins, whose synthesis rates were almost identically regulated by the three growth factors after 6 h. In the resulting relational tree, short branches connect similar images, whereas increasingly long branches join gel images with diminishing similarity. F, ChiClust clustering analysis of protein synthesis during long-term GF-stimulation. The 2DE images were clustered according to similarities between all radiolabeled protein spots.

