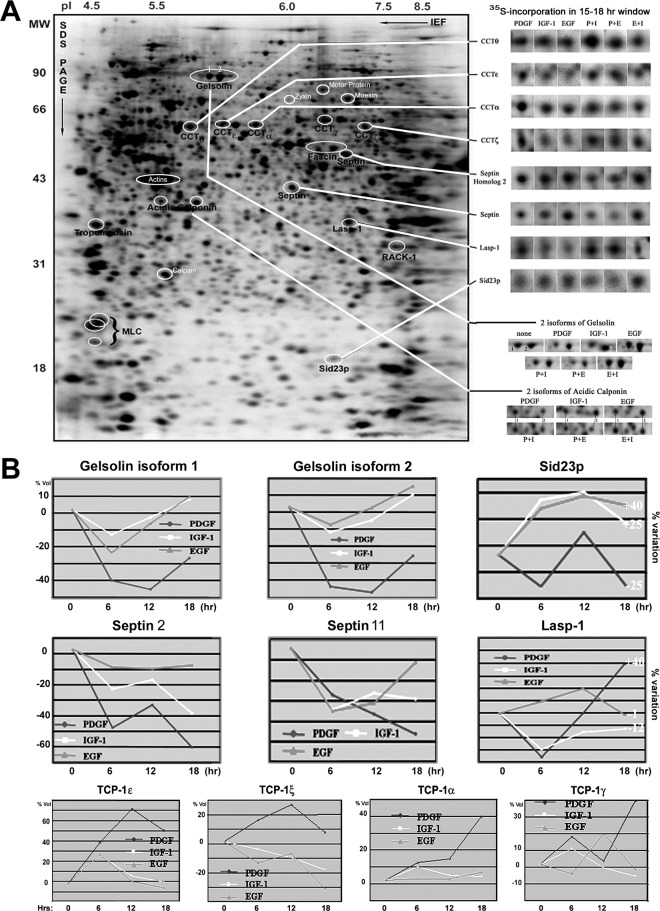
Fig. 8.
A, 2DE autoradiogram of 35S-labeled proteins in IGF-1 treated cells, indicating the position of differentially regulated cytoskeletal proteins and regulators. The representative autoradiogram images at the right indicate the different synthesis rates of ten cytoskeleton proteins in GF-stimulated or costimulated cells. B, Graphic illustrations of the regulation of cytoskeletal protein synthesis in EGF, IGF-1, and PDGF treated cells.

