
Fig. 9.
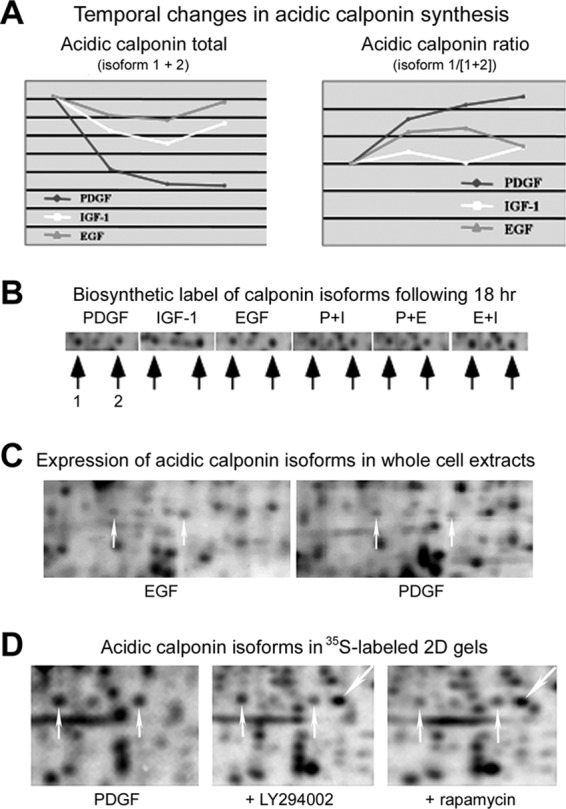
A, Graphic representations of GF-induced temporal changes in the synthesis of two acidic calponin isoforms. B, Representative autoradiogram images demonstrating the abundance of newly synthesized calponin forms in GF-stimulated cells. C, Fluorescence stained gel images demonstrating reduced expression and inverse ratio between calponin isoforms in PDGF-treated, compared with EGF-treated, 3T3 cells. D, Autoradiograms showing the effects of treatment with PI3K or mTOR inhibitors on PDGF-induced calponin synthesis.