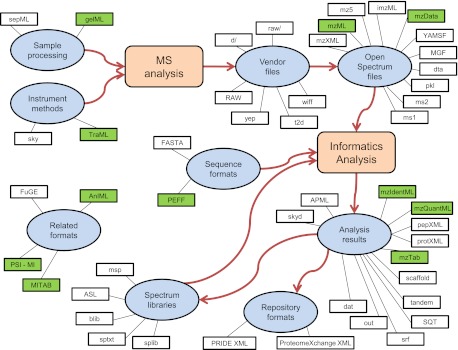
Fig. 1.
Overview graph of the mass spectrometry proteomics formats discussed here. The overall workflow of MS proteomics is depicted by the large shapes and the arrows connecting them. Ovals represent the major data types within the workflow. The small rectangles represent the individual file formats associated by an edge to their general data type. Shaded formats are officially approved or soon-to-be-approved standards. Different formats associated with the same data type are not necessarily redundant or equivalent.

