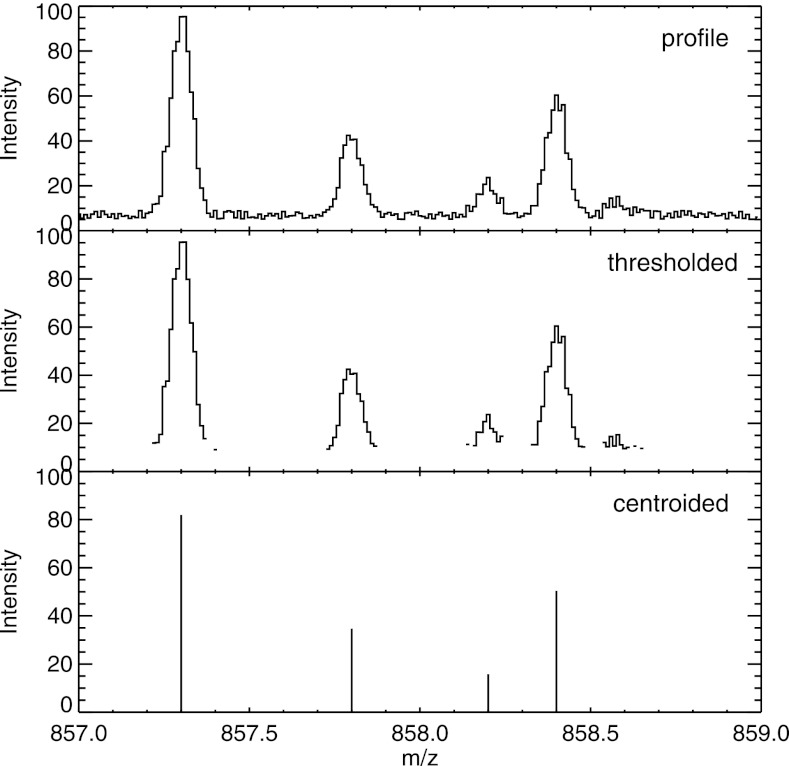
Fig. 2.
Example of a set of peaks depicted in “profile” mode as it is collected and commonly written by an instrument; “thresholded” mode, in which values below a certain threshold (or sometimes just zeros) are not written out to save space; and “centroided” mode, wherein only the detected peaks are written. Formats such as mzML can encode any one of these types per spectrum.

