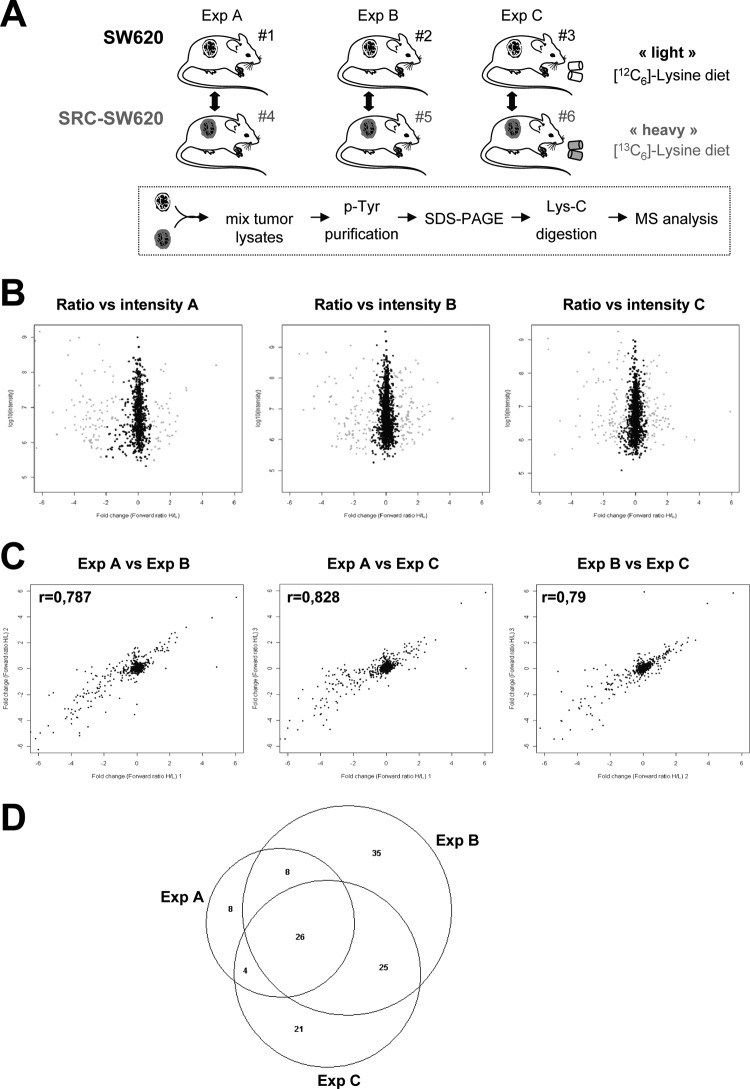
Fig. 3.
Analysis of SRC oncogenic signaling in xenograft tumors by SILAC mouse. A, schematic overview of the SILAC experimental procedure applied to mouse xenografts. B, SILAC in mouse xenografts after 30 days of heavy mouse diet allowed the quantification of tyrosine phosphorylation in three independent experiments. The heavy/light ratio for each protein is represented as a function of the signal intensity. Proteins are colored in gray when scored as significant by MaxQuant. C, scatter plot showing the correlation between pairs of the three independent experiments. Pearson correlation coefficient (r) calculated by Perseus is shown. D, Venn diagram showing the number of common and specific SRC targets identified in the three independent mouse SILAC experiments.

