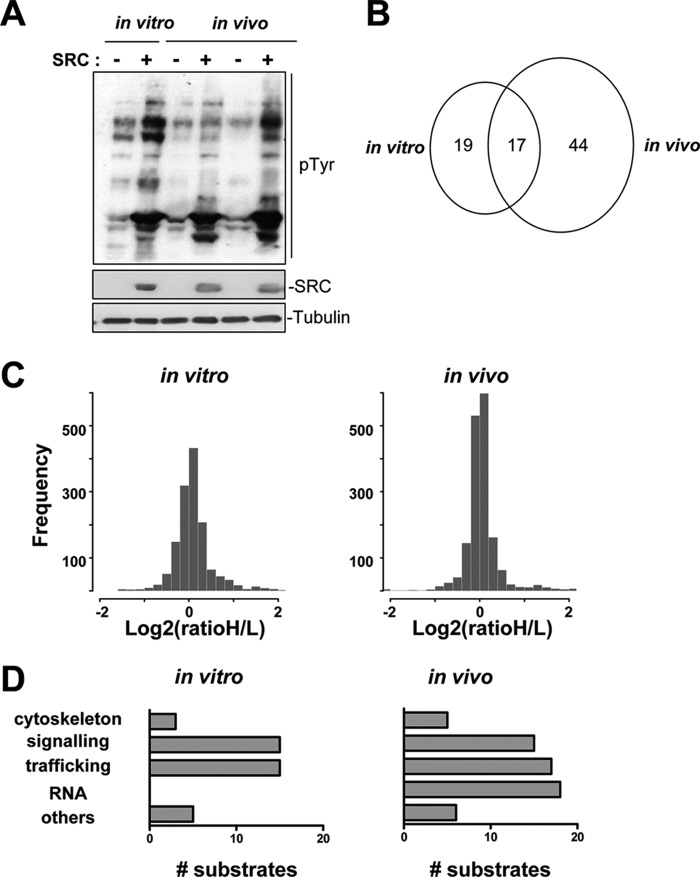
Fig. 4.
Comparison of in vivo and in vitro SRC signaling recorded via MS analysis. A, Western blot analysis using the 4G10 antibody of SRC-induced tyrosine phosphorylation in total protein lysates from parental SW620 and SRC-SW620 cells (in vitro) and from xenograft tumors derived from SW620 and SRC-SW620 cells (in vivo). The levels of tubulin and SRC are also shown. B, Venn diagram showing the number of common and specific SRC targets identified by mouse SILAC. C, histograms showing the distribution of in vitro and in vivo SILAC ratios. D, comparative clustering analysis of SRC targets identified via SILAC in vivo and in vitro. The number of proteins identified in each category is shown.

